Pathway Ranking Tool
Pathway Ranking Tool. Dimitri Kosturos Linda Tsai SoCalBSI, 8/21/2003. Project Overview. Project Overview. BioDiscovery, Inc. at Marina del Rey Analyzing microarray data on pathway level instead of individual gene level Methods: -Enrichment Analysis -Permutational Statistics

Pathway Ranking Tool
E N D
Presentation Transcript
Pathway Ranking Tool Dimitri Kosturos Linda Tsai SoCalBSI, 8/21/2003
Project Overview Project Overview • BioDiscovery, Inc. at Marina del Rey • Analyzing microarray data on pathway level instead of individual gene level • Methods: • -Enrichment Analysis • -Permutational Statistics • -S. Metric • -Multivariate test
Project Overview, cont. • Validation of statistical methods • 2 data sets: Brain Tumor, Interferon-gamma. • Sources of annotation: BioCarta, Kegg, Gene Ontology.
Project Flowchart microarray algorithm phenotype pathway
Research and Development in GeneSight • GeneSight is a data analysis software • Feature: -Statistical significance testing -Multiple Data Visualizations -Automated gene annotation -Complete result reports -Pathway analysis (?)
Biology of Brain Tumor • Glioblastoma multiforme(GBM) is the most malignant of the glial tumors, classified as grade IV. • Many brain tumors are currently incurable. • Average survival time: 1 year
Bad Genes Foment Trouble • Oncogenes: promote normal cell growth • Tumor suppressor genes: retard cell growth http://www.med.harvard.edu/publications/On_The_Brain/Volume4/Number2/SP95Awry.html
Biology of Interferon • Interferon is a class of cytokines that mediate antiviral, antiproliferative, antitumor activites, etc. • IFN gamma is produced by T lymphocytes in response to mitogens or to antigens. • IFNs bind to their receptors and initiate JAK-STAT signaling cascade.
Biology of Interferon, cont. http://www.grt.kyushu-u.ac.jp/eny-doc/pathway/ifn_gamma.html
Gene Annotations • Grouping related genes together into pathways (A) BioCarta Ex: p53 Signaling Pathway (B) KEGG Ex:Citrate cycle (TCA cycle) • Grouping genes into structured, controlled vocabularies (ontologies) Gene Ontology -Biological Process. Ex: angiogenesis, apoptosis -Molecular Function. Ex: DNA binding activity -Cellular Component. Ex: nucleus, mitochondria
Steps: 1. Mann-Whitney Test: obtain list of probe sets that satisfy a certain p-value. 2. Cluster analysis: see how many of listed probe occur in a cluster (pathway). Example: Original data: 12,625 genes. Select genes p-value <0.001. =>narrow to 927 genes. 2. Cluster those 927 genes into clusters. Traditional method of ranking gene pathways
How Affy. Microarray Chips Work Best results: Genes hybridize perfectly with Perfect Match, and not at all with Mismatch. PM: Perfect MatchMM: Mismatch http://www.ucl.ac.uk/oncology/MicroCore/HTML_resource/Norm_Affy1.htm
Normal Normal Tumor Tumor Probe Set A 4.5 3.8 10.2 11.1 Probe Set B 2.3 2.7 13.5 13.6 Probe Set C 7.8 8.2 1.4 1.8 Probe Set A 3.5 4.2 8.9 9.6 Conditions Genes Example of GeneSight PlotData Theoretical Tumor Expression Levels (Log Transformed) Notice column replicates, Probe Set replicates.
Given Data Sets • Given two data sets: Brain Tumor, IFN-γ • Brain Tumor Data Set has 5+ tumor types,however, only 2 Tumor types were used (Denovo Glioblastoma, Progressive Glioblastoma) • IFN-γ Data Set: the entire data set was used.
What and why? • Goal: write a prototype extension to GeneSight that uses permutational statistics to develop a custom distribution for a given Microarray data set. • Overall significance: the software provides a list of (potentially) significant pathways that enables researchers to focus their work.
E E C C 1 2 3 4 E C E C 1 2 3 4 What is permutational statistics? (In this context.) Choose different Control and Experiment groupings (permute). By iterating through an adequate number of permutations, we can determine if a pathway is likely to be significant (p-value).
Permutational Stats. • There are two versions of the S. Metric currently implemented. M = Number of Genes flagged as significant Total = Total number of Genes in the Pathway S. Metric I = S. Metric II =
(Layman's) How Statistics Works Data Statistic P-Value After all permutations are done, calculate the p-Value Permute Here S. Metric I, II
Initial Significance Flagging S. Metric Algorithm • Take at least 10,000 unique permutations. A unique permutation is determined by a Permute class.For each condition For each permutation For each gene Calc. Mean diff. Calc. T-stat End For For each pathway store the statistic End for End for calcPvalue(stored statistic)End For pValue
Limitations • Computational Power (Memory, CPU) • Required number of replicates (8,8)
Validation of pathway analysisMethod 1 ???? Problem: lack of insignificant pathways
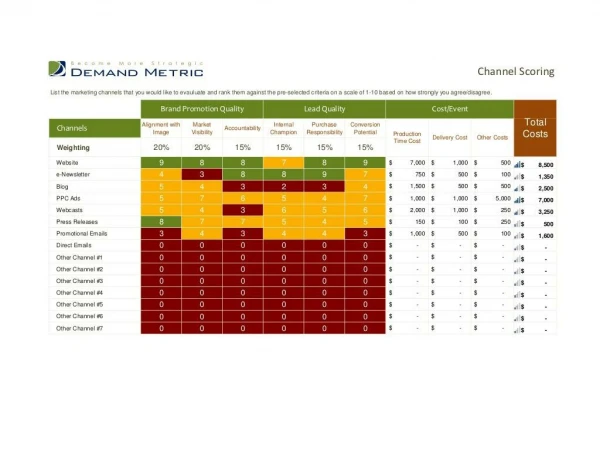
Validation of pathway analysisMethod 2 Comparision of Prediction Methods 16 14 12 10 # of identified significant pathways 8 6 4 2 0 1 6 11 16 21 26 31 36 41 46 51 56 61 66 71 76 81 86 91 96 # of Pathways in BioCarta sorted by P-value
Biological Limitations • Prediction of pathways to be significant in the conditions of interest is subjective. • Assumption of similar biological states between Denovo Glioblastoma and Progressive Glioblastoma.
Future Direction • Finish modifying the Multivariate Statistic for use in the permutational method. This method uses PCA and Multivariate statistics. • Finish Validating the data produced using the Multivariate Statistic.
Initial Results of Multivariate Stat. Sorted by p-value.
Conclusion • It is not clear which is better the S. metric or traditional Enrichment Analysis. • Improvements can be made to the S. metric.
Acknowledgements • Dr. Bruce Hoff • Dr. Anton Petrov • SoCalBSI: Dr. Jamil Momand, Dr. Sandra Sharp, Dr. Nancy Warter-Perez, Dr. Wendie Johnston • National Science Foundation • National Institute of Heath