Download
1 / 16
390 likes | 774 Vues
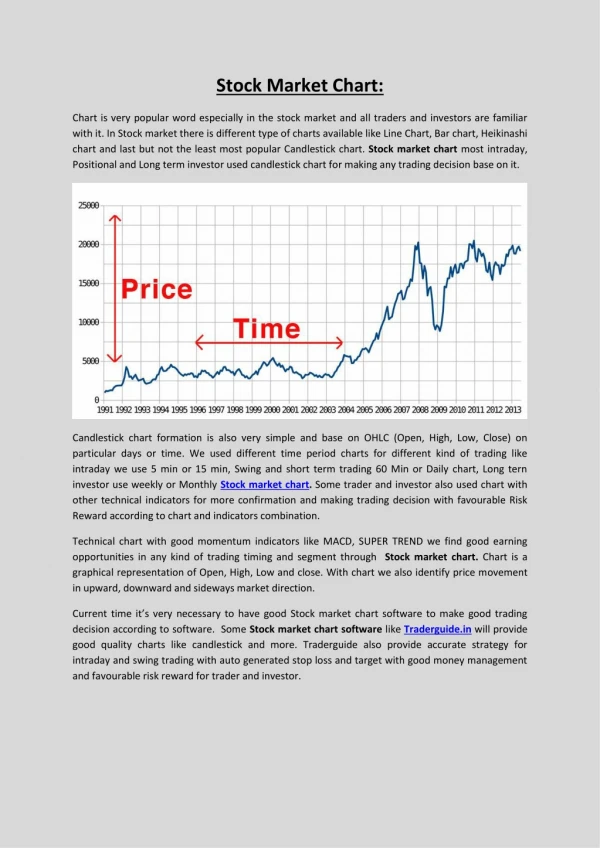
How to Read the Stock Chart. Stock charts. There are several different kinds of charts: - line chart - OHLC chart - candlestick. Line charts. The line chart is a single line with starting and ending points. The points may be a session’s opening or closing price.

E N D
How to Read the Stock Chart
Stock charts There are several different kinds of charts: - line chart - OHLC chart - candlestick
Line charts The line chart is a single line with starting and ending points. The points may be a session’s opening or closing price. The line chart is limited because it does not provide enough details to judge a stock’s performance.
OHLC chart “OHLC” stands for “open, high, low, close.” The daily entry to the chart has three attributes: - a vertical line stretching from the day’s high to low price - a small horizontal line attached to the left of the vertical line, representing the session’s opening price - a small horizontal line attached to the right of the vertical line, representing the session’s closing price
Candlestick charts The most useful of all charts is the candlestick. This chart has a rectangular real body. A white real body appears when the price moved up A black real body appears when the price moved down. The top and bottom of the rectangle represent the session’s opening and closing prices. Sticking out from the top and bottom are the shadows. These represent the range of trading during the session, from highest to lowest price.
Candlestick reversal patterns Some candlestick reversals Reversal indicators may be only one session: - doji - spinning top They may consist of two consecutive sessions: - engulfing - harami Reversals can also be found in three consecutive sessions: - three white soldiers - three black crows - abandoned baby Among the many useful patterns are single-session, two-session and three-session reversal signals. These predict a change of direction in price. However, all reversal signals should be confirmed before they are acted on. Confirmation may consist of other candlesticks and many other reversal indicators. Hundreds of different candlestick signals may be found. This section explains only a few of these.
Western technical analysis Some technical signals Technical signals may relate to the trading range: - resistance - support They may consist of tests of the border and reversal: - head and shoulders - inverse head and shoulders Technical signals also appear when the prior trading range changes and price breaks out to form a new range: - gaps - breakouts Traditional Western technical analysis is based on price patterns that signal reversal. There are dozens of signals. Some of the most useful include only a few demonstrated here. Western signals may confirm candlestick reversal indicators, such as candlesticks may serve as confirmation for Western signals.
Volume indicators and momentum oscillators Other technical signals Volume: - indicators include calculated volume tests - volume spikes are also good confirmation signals. Momentum: - among the many volume indicators is the Relative Strength Index (RSI), which creates an index from 1 to 100. Above 70 indicates overbought; below 30 indicates oversold. A volume indicator is any test of volume in relation to price. Volume indicators work as confirmation of reversal. One of the best confirmation signals is the volume spike, a one-day or two-day rise in volume, followed by a return to normal levels. A momentum oscillator is a calculation of price averages. It tests the strength or weakness of a trend, as well as its speed of movement. As momentum begins to slow down, the index of a momentum oscillator is likely to move into overbought or oversold range. This foretells a likely reversal.
Conclusion Candlestick charts are the most useful format, as they summarize all price information in a visual manner. Candlestick reversals may be confirmed with traditional Western signals and price tests. Further confirmation comes from volume signals and from momentum oscillators.