Download
1 / 93
960 likes | 1.4k Vues
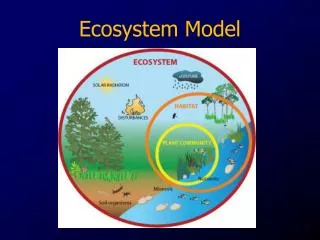
What is an Ecosystem?. An ecosystem refers to the natural systems in which energy is passed from one organism to another and matter is recycled. An ecosystem includes all of the biotic and abiotic factors which are interrelated in an area. Ecology.

E N D
What is an Ecosystem? • An ecosystem refers to the natural systems in which energy is passed from one organism to another and matter is recycled. • An ecosystem includes all of the biotic and abiotic factors which are interrelated in an area.
Ecology • Ecology is the study of ecosystems and the way in which living things interact with each other and their surroundings. • Ecologist take quantitative and qualitative measurements of the abiotic environment, individual organisms and populations. These measurements provide insight into the interactions between organisms and their environment. • Changes within an ecosystem cause consequential changes in other areas of the ecosystem and ecologists attempt to predict and study the ways in which ecosystems respond to change.
The biosphere • The biosphere refers to all of the ecosystems on earth. • While ecologists can study discrete areas and systems, which they call ecosystems, the reality is that all ecosystems are interrelated in some way.
Populations • A population is a group of organisms of the same species living in a certain area at a particular time. • A population can change in: • Density • Geographical distribution • Age distribution • Fecundity • Size • Relative abundance
Population Density • Population density is the number of individuals of a species per unit area. • For example, the number of sheep per hectare. • Population density is calculated by dividing the total number of individuals by the total area. The result will be a number per unit area.
Geographical Distribution • This is a measurement of population dynamics which gives an indication of the places within an environment where individuals of a population are found. • This information is normally presented in graphical or map form however it can also be presented in tabular form with reference to specific points within an ecosystem.
Age Distribution • This information is normally presented as bar graphs or specialised histograms. • It provides information on the relative numbers of individuals within a population within specified age ranges
Fecundity • The fecundity of a population refers to the number of offspring produced in a given time in relation to the number of mature females. • This information is useful when studying the population dynamics of a population, particularly in relation to its potential for growth.
Population Size • The number of individuals is an important measure of any population. • A related measure is the growth rate. This provides information on the rate at which a population will increase. • It is normally expressed as a number per proportion of the original population. • 50 per 1000 increase in the sheep population. • A percentage can also be calculated to give a clear picture.
Calculating population growth • The formula for calculating population growth takes into account all additions and reductions in the population. • The formula is: • (births + immigration)-(deaths + emigration)
A worked example • The population of wood ducks in Kelmscott fluctuates considerably in the course of a year. In January 2003, the population was 15 000. During the course of the year, their were 8000 births and 4500 deaths. A further 2000 birds immigrated into Kelmscott and 1500 birds left the area.
A worked example • First, substitute the values into the formula • = (8000 + 2000) – (4500 +1500) • This equates to 4000 increase. • As a proportion of the total population, this would be • 4000/15 000 = growth rate of .26666
A worked example • .26666 per individual does not provide a clear picture of the growth rate of the population. • So, (4000/15000)x100 = 26%. This means that the population of wood ducks in Kelmscott is increasing at a rate of 26% per year.
Relative abundance • The relative abundance of an organism reflects a relationship between one population and another. • An example of this would be the relationship between rabbits and foxes. We might say that there are 25 rabbits to each fox or the fox population is 25% of the rabbit population.
Question Set 1 • What is an ecosystem? • An ecosystem refers to the natural systems in which energy is passed from one organism to another and matter is recycled. • An ecosystem includes all of the biotic and abiotic factors which are interrelated in an area.
Question Set 1 • What is population density? • Population density is the number of individuals of a species per unit area.
Question Set 1 • What is the formula for calculating the growth rate of a population? • (births + immigration)-(deaths + emigration)
Question Set 1 • What is fecundity a measure of in a population? • The fecundity of a population refers to the number of offspring produced in a given time in relation to the number of mature females.
Communities and Biomes • A community is a group of organisms belonging to different species which live in the same area and interact with one another. • A biome is a major ecological unit within a community.
Trophic Relationships • Ecologists spend considerable time studying the feeding relationships between organisms. • Particularly, ecologists will examine the relationship between autotrophs and heterotrophs. • The trophic levels in an ecosystem represent the feeding hierarchy.
Food Chains • A food chain represents the one to one feeding relationship between organisms. • All food chains should include an autotroph as this is the original source of energy in any ecosystem. • Each arrow represents the transfer of energy from one organism to another. • It is important to note that energy from the sun and energy lost to the environment as heat are generally not included in food chains.
Food Webs • Food webs are a more comprehensive representation of the feeding relationships which occur in an ecosystem. • They show all of the interrelationships between organisms in an ecosystem. • Food webs also show the competition for various food sources within an ecosystem.
Energy Transfers • It is important to note that not all of the energy available at one trophic level is transferred to the next. • Approximately 10% is transferred from one trophic level to the next while significant amounts of energy are lost at each trophic level in the form of heat. • It is also important to note that energy is not recycled in an ecosystem.
Question Set 2 • What is the difference between a food web and a food chain? • A food chain represents the one to one feeding relationship between organisms. • Food webs are a more comprehensive representation of the feeding relationships which occur in an ecosystem. • They show all of the interrelationships between organisms in an ecosystem. • Food webs also show the competition for various food sources within an ecosystem.
Question Set 2 • Describe how energy is transferred through the various trophic levels of an ecosystem. • It is important to note that not all of the energy available at one trophic level is transferred to the next. • Approximately 10% is transferred from one trophic level to the next while significant amounts of energy are lost at each trophic level in the form of heat. • It is also important to note that energy is not recycled in an ecosystem.
Matter Dynamics • Examination of matter transfer in an ecosystem shows that matter is recycled . • Matter moves from autotrophs, through the various heterotrophic levels. • Ultimately, all matter passes through the decomposer level where it is broken down to its simplest form. • This results in the release of large amounts of heat energy and fundamental chemical substances which can then be re-utilised by autotrophs.
Matter Cycles • There are a number of significant matter cycles within ecosystems. The models of these illustrate how specific substances are cycled through an ecosystem. • These substances are: • Carbon • Nitrogen • Phosphorous • Water
Pollution of natural cycles • Generally, natural cycles exist in a state of equilibrium, whereby matter flows from one stage of the cycle to the next. There is not a build up matter at any one point. • However, the activities of man can result in a build up of matter in these natural cycles. • We call this build up pollution.
Pollution • An example of human activity resulting in a loss of equilibrium in a natural cycle is the build up carbon at particular points in the carbon cycle. • Carbon is released, as CO2, when we burn fossil fuels. Fossil fuels are a stored form of carbon in the environment. This carbon would normally remain fixed in oil reserves.
Pollution • As a result of our burning fossil fuel, large amounts of carbon are being released into the atmosphere. • This is having the significant effect of causing what we call global warming.
Cumulative Toxins • Cumulative toxins are those chemicals which have two characteristics: • They are passed from one trophic level to the next. • They do not break down. • The consequence of this is that these toxins gradually build up in the ecosystem. The higher the trophic level at which an organism functions, the more of these cumulative toxins will be present in their bodies. This is known as the magnification effect or biological magnification.
DDT • DDT is a banned pesticide which was used in the early to mid 20th century. • After extensive use, ecologist began to notice an accumulation of this substance in the various animals found in an exposed ecosystem. • They also noticed that the higher the trophic level of an organism the more DDT was found in their tissue.
DDT • An extreme consequence of this was the near extinction of large predatory birds, such as the Wedgetailed Eagle. • The effect of this cumulative poison on these birds was a reduction in the thickness of egg shells. • The birth rates in these birds dropped significantly before the effect of this toxin was noticed.
Metals in the environment • Metals can also become a cumulative toxin in the environment. • These metals include lead and mercury which cause damage to the nervous system. • They also include the metals cadmium, arsenic and selenium which are carcinogenic.
Question Set 3 • What is pollution? • Generally, natural cycles exist in a state of equilibrium, whereby matter flows from one stage of the cycle to the next. There is not a build up matter at any one point. • However, the activities of man can result in a build up of matter in these natural cycles. • We call this build up pollution.
Question Set 3 • What is biological magnification? • Toxins gradually build up in the ecosystem. The higher the trophic level at which an organism functions, the more of these cumulative toxins will be present in their bodies. This is known as the magnification effect or biological magnification.
Biological Pyramids • Biological pyramids represent the distribution of matter in the environment. • They include: • Biomass pyramids • Abundance pyramids
Abundance pyramids • Abundance pyramids show the number of organisms at each of the trophic levels of an ecosystem. • Generally, there are greater numbers of organisms at the base of these pyramids, and numbers gradually decrease towards the top. • It is important to note that abundance pyramids can be a little deceiving since greater numbers of organisms at a trophic level may not mean that there is more biomass. Millions of insects at a trophic level would have very little biomass.
Biomass Pyramids • Biomass pyramids are more often used by ecologists to represent the distribution of matter in an ecosystem. • Each of the levels of a biomass pyramid represents the amount of matter (productivity) which is contained in that level.