Download
1 / 1
10 likes | 82 Vues
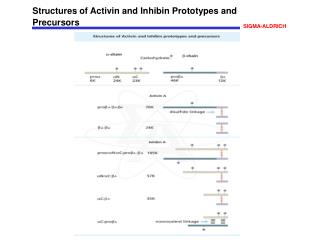
Supplement f ig . 4 Effects of Activin A on osteoblastic differentiation of HPDLC-3O and -3Q. (B). (A). mRNA expression (/ b -actin ). Area (mm 2 ). **. **. Area (mm 2 ). mRNA expression (/ b -actin ). **. **. (C). AR. VK. AR. AR. **. Ca +ACV. **. Ca +ACV. Ca. ACV.

E N D
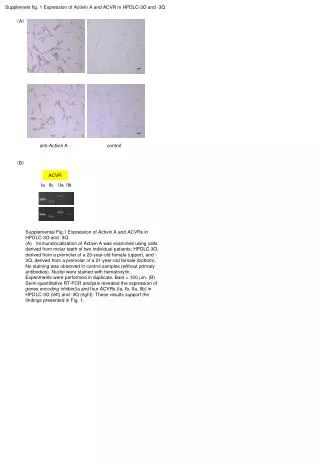
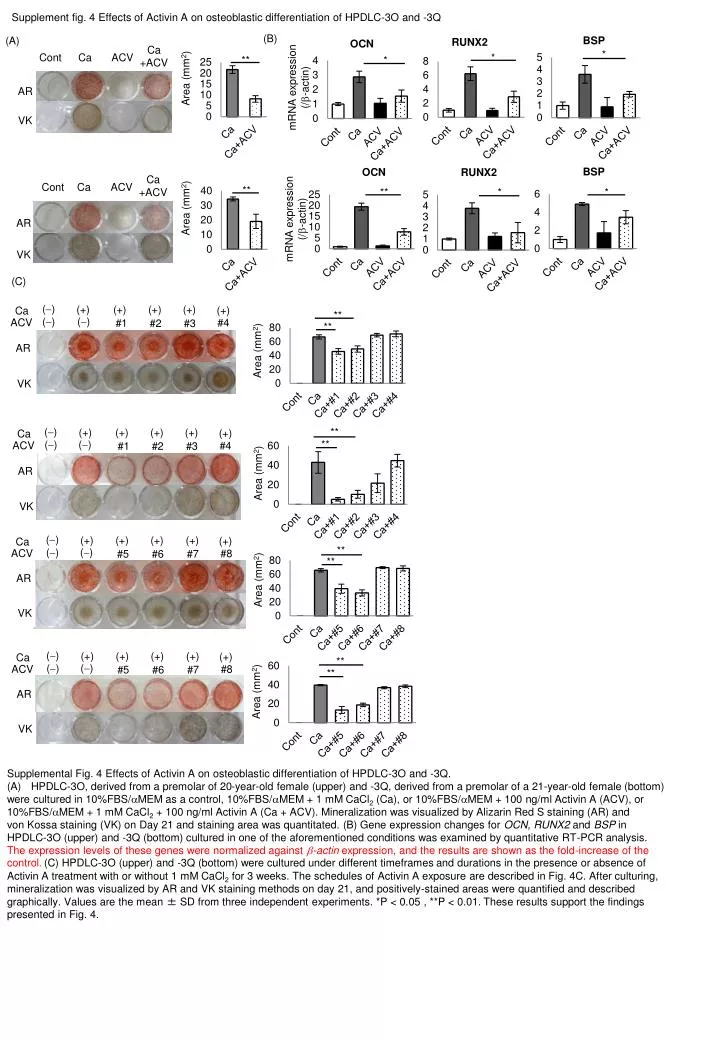
Supplement fig. 4 Effects of Activin A on osteoblastic differentiation of HPDLC-3O and -3Q (B) (A) mRNA expression (/b-actin) Area (mm2) ** ** Area (mm2) mRNA expression (/b-actin) ** ** (C) AR VK AR AR ** Ca +ACV ** Ca +ACV Ca ACV Cont Ca ACV Cont (-) (-) (-) (-) (+) (+) (+) (+) (+) (+) (+) (+) (+) (+) (+) (+) (+) (+) (+) (+) (+) (+) (+) (+) Ca Ca Ca Ca VK VK AR (-) (-) (-) (-) (-) (-) (-) (-) ACV ACV ACV ACV Area (mm2) VK ** ** AR #4 #4 #8 #8 #1 #1 #5 #5 #2 #2 #6 #6 #3 #3 #7 #7 Area (mm2) VK Supplemental Fig. 4 Effects of Activin A on osteoblastic differentiation of HPDLC-3O and -3Q. HPDLC-3O, derived from a premolar of 20-year-old female (upper) and -3Q, derived from a premolar of a 21-year-old female (bottom) were cultured in 10%FBS/MEM as a control, 10%FBS/MEM + 1 mM CaCl2 (Ca), or 10%FBS/MEM + 100 ng/ml Activin A (ACV), or 10%FBS/MEM + 1 mM CaCl2 + 100 ng/ml Activin A (Ca + ACV). Mineralization was visualized by Alizarin Red S staining (AR) and von Kossa staining (VK) on Day 21 and staining area was quantitated. (B) Gene expression changes for OCN, RUNX2 and BSP in HPDLC-3O (upper) and -3Q (bottom) cultured in one of the aforementioned conditions was examined by quantitative RT-PCR analysis. The expression levels of these genes were normalized against -actin expression, and the results are shown as the fold-increase of the control. (C) HPDLC-3O (upper) and -3Q (bottom) were cultured under different timeframes and durations in the presence or absence of ActivinA treatment with or without 1 mM CaCl2 for 3 weeks. The schedules of Activin A exposure are described in Fig. 4C. After culturing, mineralization was visualized by AR and VK staining methods on day 21, and positively-stained areas were quantified and described graphically. Values are the mean ± SD from three independent experiments. *P < 0.05 , **P < 0.01.These results support the findings presented in Fig. 4. Area (mm2) ** ** AR AR AR AR VK VK VK VK Area (mm2) * * * ** * *