Analyzing ELA and Math Proficiency Trends in 2nd to 5th Grade Subgroups (2011-2016)
This report analyzes the English Language Arts (ELA) and Math proficiency trends of 2nd to 5th grade subgroups over the past five years. By examining Baseline 4-Sight data, we identify strengths and weaknesses in student skills and instructional effectiveness. Additionally, we consider factors such as attendance and behavior rates that may influence academic outcomes. The analysis aims to inform decision-making for instructional improvements, ensuring that our school meets and exceeds proficiency targets. This data-driven approach ensures we provide the best educational support for our students.

Analyzing ELA and Math Proficiency Trends in 2nd to 5th Grade Subgroups (2011-2016)
E N D
Presentation Transcript
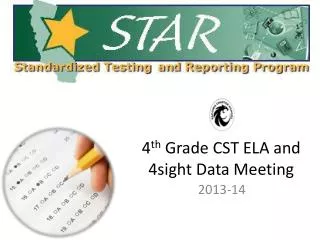
PCSCST Data Meeting 2011-12
4th Grade Last 5 years(ELA) summary narrative
2nd Grade 4-sight Baseline 44 47 41 41 37
3rd Grade 4-Sight Baseline 48 41 39 36 39
4th Grade 4-Sight Baseline 63 55 44 38 40
5th Grade 4-sight Baseline 67 59 60 55 54
The Magic Number is…….. 812 The Number of Students Reading at Grade Level!!!! Baseline
Target Concerns • What skills were strong/ weak? • What in our instructional process (instruction and structures) led to these results (positive and negative)? • What areas, other than instruction but within our control (such as attendance rate, tardy rate, suspension rate), contributed to these results (positive and negative)? • What instruction decisions (structural and instructional) can we make to increase the likelihood of our school meeting or exceeding?