6.1 Solving Systems by Graphing
Learning Goals. Identify solutions of linear equations in two variables. Solve systems of linear equations in two variables by graphing. Vocabulary. systems of linear equations solution of a system of linear equations. 6.1 Solving Systems by Graphing. Why are we learning this?.

6.1 Solving Systems by Graphing
E N D
Presentation Transcript
Learning Goals Identify solutions of linear equations in two variables. Solve systems of linear equations in two variables by graphing. Vocabulary systems of linear equations solution of a system of linear equations 6.1 Solving Systems by Graphing Why are we learning this? You can compare cost by graphing a system of equations Warm Up Evaluate each expression for x = 1 and y= –3. x– 4y Write each expression in slope-intercept form. 2. 0 = 5y + 5x
Helpful Hint If an ordered pair does not satisfy the first equation in the system, there is no reason to check the other equations. A system of linear equations is a set of two linear equations. A solution of a system of linear equations is an ordered pair (x, y), that make both equations true. Example 1A: Identifying Systems of Solutions Tell whether the ordered pair is a solution of the given system. (5, 2); 3x – y = 13
Example 1B: Identifying Systems of Solutions Tell whether the ordered pair is a solution of the given system. x + 3y = 4 (–2, 2); –x + y = 2 (-2, 2) is a solution to what?
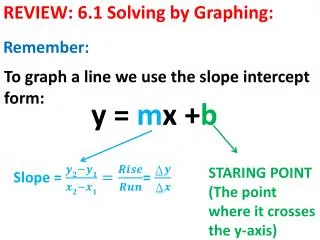
y = 2x – 1 Helpful Hint y = –x + 5 Sometimes it is difficult to tell exactly where the lines cross when you solve by graphing (make sure to use a ruler!). It is good to confirm your answer by substituting it into both equations. All solutions of a linear equation are on its graph. So how do we find the solution of a system of linear equations.
y = –2x– 3 y = x Example 2A: Solving a System Equations by Graphing Solve the system by graphing. Check your answer. y = x y = –2x – 3 Graph the system. Check:
Check It Out! Example 2a Solve the system by graphing. Check your answer. y = –2x – 1 y = x + 5
Example 3:Problem-Solving Application You and your friends want to go bowling. You don’t know how many games you will play yet but you want to compare costs. Bowl-o-Rama charges $2.50 per game plus $2 for shoe rental and Bowling Pinz charges $2 per game plus $4 for shoe rental. Which bowling place is better?
Total pages every night already read. number read is plus Wren y = 2 x 14 + x y 3 + Jenni = 6 Example 3:Problem-Solving Application Wren and Jenny are reading the same book. Wren is on page 14 and reads 2 pages every night. Jenny is on page 6 and reads 3 pages every night. After how many nights will they have read the same number of pages? How many pages will that be? As seen from these 2 application questions, there can be many different real-world example. When you are done Practice B, create your example with a solution. Include a picture or diagram to help others visualize the problem