Download
1 / 32
330 likes | 549 Vues
Frequency of Proteinuria in Trial 99*. Page 32 - Table 17. 15. Effect of Back-titration in Patients With an Elevated Urinary Total Protein Excretion Rate. Maximum. 1200. 90 th percentile. 1000. 800. 75 th percentile. Mean total protein excretion rate, µg/min. 600. Median. 400.

E N D
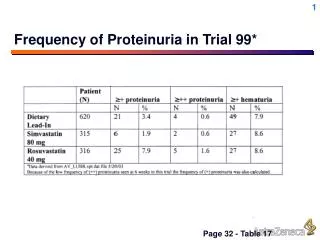
Frequency of Proteinuria in Trial 99* Page 32 - Table 17
15 Effect of Back-titration in Patients With an Elevated Urinary Total Protein Excretion Rate Maximum 1200 90thpercentile 1000 800 75th percentile Mean total protein excretion rate, µg/min 600 Median 400 25th percentile 200 10th percentile 0 Minimum 80 mg 40 mg Rosuvastatin dose 18 patients are included in this figure. Values below the limit of assay sensitivity are represented as zero.
32 Resolution of Proteinuria With Rosuvastatin Dose ReductionFirst Back-titration Visit (n = 752) Briefing document May 7 renal section, T1 4MSU 21/46 (46%) patients had urine dipstick blood ≥ 1+ 20/21 (95%) no longer had combined proteinuria at first back-titration visit.
40 Serum Calcium, Phosphorus, and Potassium in Patients With or Without Proteinuria: Rosuvastatin 80 mgCombined All Controlled/Uncontrolled and RTLD Pool Briefing document May 7 renal section, T1 4MSU Baseline and on-treatment values for patients with urine dipstick protein levels that remained “none or trace” or shifted to “++ or greater” during treatment .
32 Frequency of Proteinuria by VisitCombined All Controlled and RTLD Pool Briefing document May 7 renal section, T1 4MSU
15 Effect of Back-titration of Rosuvastatin From 80 to 40 mg on Urinary Proteins
32 Association of Antihypertensive Drug Use With Proteinuria in Hypertensive Patients Receiving Rosuvastatin 40 mg (n = 701)All Controlled/Uncontrolled Pool Proteinuria - “none or trace” to “2+ or greater”.
2 Urinary Protein Electrophoresis Patterns in Patients With Dipstick Positive Proteinuria Crestor ISSU Table 49 †Baseline none to 1+
9 Most Frequent Adverse EventsAll Controlled Pool †Includes data for subjects who received rosuvastatin 80 mg.
Most Frequent Adverse Events by Dose Fixed-Dose Controlled Pool
40 Duration of Treatment and Number of Urinalysis Visits per DoseCombined All Controlled and RTLD Pool
< 40 mg/dL ≥ 40 mg/dL HDL-C: % Change From Baseline Rosuvastatin : Baseline HDL-C < 40 mg/dL or ≥ 40 mg/dLTrial 65 – STELLAR (Wk 6) N 21 27 27 135 133 130 Data presented as LS mean.
Icterus Case 1 (310/01237) • 68 year-old Caucasian male, who after 17 weeks of rosuvastatin 10 mg treatment noted icterus and brown urine • ALT and AST values in this subject increased to 223 U/L (3.4 x ULN) and 91 (2.5 x ULN) with a mildly elevated bilirubin of 2.1 mg/dL (2.1 x ULN) • Patient was hospitalized; rosuvastatin, metformin, captopril, nilvadipine, clopidogrel were all withdrawn • Liver histology showed normal parenchyma. He was discharged. • Follow-up liver function 1 week after the event showed resolution.
Icterus Case 2 (2265/09060) • 73 year-old Caucasian male subject, who after 11 weeks of rosuvastatin 10 mg treatment reported icterus. • ALT and AST values in this subject reached 914 (38.1 x ULN) and 699 (38.3 x U/L), respectively, with a bilirubin of 11.8 mg/dL (10.7 x ULN). • Hepatitis titers: HepBs Ag negative, positive IgM Anti-HepBc and HepA IgG antibodies • Follow up liver function tests showed resolution
Albumin Low molecular weight proteins Protein Handling by the Kidney Tubular proteinuria Glomerular proteinuria Normal Plasmaconcentration,mg/L 40,000 4 40,000 4 40,000 4 2 2 2 2 2000 2 Filtered load, mg/dayif GFR – 150L/day 360,000 360 360 360 360 360 50 50 95 95 95 95 % reabsorbed Daily excretion, mg 18 18 18,000 18 180 180
31 Creatinine Changes in Patients With Proteinuria at Last Visit, ≥ 96 Wk of Rosuvastatin TreatmentCombined All Controlled/Uncontrolled and RTLD Pool C 9.4.5.4.5.2, C9.9.4.5.4.5 †Includes patients who back-titrated from the 80-mg dose. No patients with creatinine > 1 mg/dL.
Post Launch Safety Assessment Ongoing Clinical Trials Program • Atherosclerosis regression • METEOR – 840 patients; placebo-controlled 40 mg • ASTEROID – 400 patients, 40 mg rosuvastatin • Outcomes studies • GISSI-HF – 5250 patients with CHF, placebo-controlled 10 mg rosuvastatin • CORONA – 4800 patients with CHF, placebo-controlled 10 mg rosuvastatin • AURORA - 2700 patients with CRF on dialysis, placebo-controlled 10 mg rosuvastatin • JUPITER – 15,000 subjects with elevated CRP, placebo-controlled 20 mg rosuvastatin
37 Cumulative Risk of MyopathyPatients Receiving ≥ 40 mg of RosuvastatinCombined All Controlled/Uncontrolled and RTLD Pool
Familial Hypercholesterolemia (FH) • FH is common • There are 500,000 patients in the US (frequency 1 person in 500) • FH causes early CHD • Average age of CHD onset is 45 - 50 years in men, 55 - 60 years in women • FH is difficult to treat • Most FH patients cannot be adequately treated to NCEP LDL-C goal
Familial Hypercholesterolemia (FH):Cumulative Probability of CAD 1.0 Non-FH Women 0.9 Non-FH Men 0.8 FH Women 0.7 FH Men 0.6 Cumulative probability of clinical CAD 0.5 0.4 0.3 0.2 0.1 0.0 90+ 30-35 35-40 60-65 75-80 25-30 40-45 45-50 50-55 55-60 65-70 70-75 80-85 85-90 Age MED PED Registry 2001.
LDL-C: % Change From BaselineRosuvastatin vs Atorvastatin: Heterozygous FHTrial 30 (Wk 6 - 18) 20 mg 40 mg 80 mg * * * *P < .05 vs atorvastatin; data presented as LS means ± SE.
Additional LDL-C ReductionRosuvastatin 40 mg vs 20 mgStudy 30 • Baseline LDL-C 290 mg/dL • 20 mg: reduction 47% Mean LDL-C = 154 mg/dL • 40 mg: reduction 54% Mean LDL-C = 133 mg/dL Additional LDL-C reduction with 40 mg = 21 mg/dL or 13.6% further decrease over 20 mg
LDL-C: % of High-Risk FH Patients Achieving NCEP ATP III LDL-C GoalTrial 30 * *P < .05
% of High-Risk FH Patients Achieving NCEP ATP III LDL-C Goal in 2 Different Studies Rosuvastatin 40 mg Atorvastatin 40 mg +Ezetimibe 10 mg Atorvastatin 80 mg Atorvastatin 80 mg Note: no statistical analyses were performed. LDL-C: <100 mg/dL (2.59 mmol/L). Stein, et al. J Am Col Cardiol 2003.
29 Benefits of Cholesterol LoweringMeta-analysis of 38 Primary and Secondary Intervention Trials –0.0 –0.2 –0.4 Mortality log odds ratio –0.6 Total mortality (P = .004) –0.8 CHD mortality (P = .012) –1.0 0 4 8 12 16 20 24 28 32 36 40 44 48 52 % in cholesterol reduction Gould AL, et al. Circulation. 1998;97:94-952.
Relationship Between Changes in LDL-C Levels and CHD Risk: NCEP ATP III LDL-C1% decrease reduces CHD risk by 1% Third Report of the NCEP Expert Panel. NIH Publication No. 01-3670. 2001. http://hin.nhlbi.nih.gov/ncep_slds/menu.htm
Relationship Between Changes in HDL-C Levels and CHD Risk: NCEP ATP III HDL-C1% increase reduces CHD risk by 3% Third Report of the NCEP Expert Panel. NIH Publication No. 01-3670. 2001. http://hin.nhlbi.nih.gov/ncep_slds/menu.htm
* 96% 87% Reached on 80 mg Reached on 40 mg Reached on 20 mg Reached on 10 mg Achievement of NCEP ATP-II LDL-C Goals at Wk 52 (Titrated to Goal as Needed) Rosuvastatin 10 - 40 mg compared With Atorvastatin 10 - 80 mgTrial 26 100 90 80 70 60 Patients, % 50 82% 40 59% 30 20 10 0 RSV ATV *P < .05.
Effect of Rosuvastatin on Plasma Concentrations of Ethinyl Estradiol and Norgestrel
22 LDL-C: % Change From Baseline Rosuvastatin: Homozygous FH < 18 Yr Trial 54 (Wk 6 - 12) RSV 40 mg RSV 20 mg N = 8 (7 included in analysis).Four patients had defective receptor status; others were unknown. Range at Wk 12: (–47.5 to –12.5).
TG: % Change From BaselineRosuvastatin vs Placebo: Type IIB and IV Trial 35 (Wk 6) n = 7 19 10 15 11 12 10 17 10 15 Baseline TG Type IIB = 416 and Type IV = 500.Data presented as LS means.