Download
1 / 1
10 likes | 116 Vues
Cycling of Molecular Hydrogen in Subarctic Sweden. Sphagnum . Victoria Ward¹, Ruth K. Varner¹ , Kaitlyn Steele¹, Patrick Crill² ¹Institute for the Study of Earth, Oceans, and Space, University of New Hampshire, Durham, NH

E N D
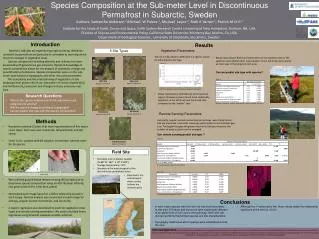
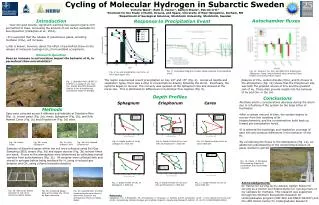
Cycling of Molecular Hydrogen in Subarctic Sweden Sphagnum Victoria Ward¹, Ruth K. Varner¹, Kaitlyn Steele¹, Patrick Crill² ¹Institute for the Study of Earth, Oceans, and Space, University of New Hampshire, Durham, NH ²Department of Geological Sciences, Stockholm University, Stockholm, Sweden • Introduction • Over the past decade, significant warming has caused organic-rich permafrost to thaw, increasing the amount of soil carbon available for decomposition (Callaghan et al., 2010). • It is expected that the release of greenhouse gases, including methane (CH₄), will increase. • Little is known, however, about the effect of permafrost thaw on the release of molecular hydrogen (H2) from wetland ecosystems. • Research Question • Does an increase in soil moisture impact the behavior of H2 in permafrost thaw microhabitats? Autochamber fluxes Response to Precipitation Event Eriophorum Carex Palsa N NiklasRakos Fig. 5: Conceptual diagram of water table response to precipitation event Fig. 12: Fluxes of H₂, CH₄, and NEE from Eriophorum, Sphagnum, Palsa, and Hummock sites, showing Tukey Kramer connecting letters report Fig. 4: H₂ and precipitation over time at the Carex sipper site The region experienced record precipitation on July 14th and 15th (Fig. 4). Across all depths and vegetation types, there was a drop in concentrations directly following the storm. Eventually, the systems began to recover. The recovery was quickest at the Sphagnum site and slowest at the Carexsite. This is attributed to differences in hydrologic flow regimes (Fig. 5). Analysis of CH₄, carbon dioxide (CO₂), and H₂ fluxes to the atmosphere (Fig. 12) shows that the Eriophorum site was both the greatest source of CH₄ and the greatest sink of H₂. These data provide insight into the behavior of H₂ and CH₄ in the soil. Fig. 1: StordalenMire (N 68°21’ E19°02’), a research site near the Abisko Scientific Research Station in the discontinuous permafrost region of Sweden. Depth Profiles • Conclusions • Methane and H₂ concentrations decrease during the storm due to a flushing of the system by the large influx of freshwater. • After a certain amount of time, the system begins to recover from this resetting of its • biogeochemistry, and the concentrations build back up toward pre-precipitation levels. • It is believed the hydrology and vegetation coverage of each site also produce differences in the behavior of soil H₂. • By considering the fluxes to the atmosphere (Fig. 12), an additional understanding of the relationship between all gases studied is gained. Sphagnum Eriophorum Carex Methods Data were collected across 4 different sub-habitats at Stordalen Mire (Fig. 1): frozen palsa (Fig. 2a), mesicSphagnum (Fig. 2b), and fully thawed Carex(Fig. 2c) and Eriophorum (Fig. 2d) sites. Fig. 6: Depth profile of H₂ at Sphagnum 1 SGS site Fig. 8: Depth Profiles of H₂ over time at Eriophorum 1 SGS site Fig. 10: Depth profiles of H₂ at Carex SGS site Samples of dissolved gases within the soil were collected using Soil Gas Sampling (SGS) arrays (Fig. 3a) and sipper devices (Fig. 3b) several times per week. Fluxes to the atmosphere were determined by collecting manual samples from autochambers (Fig. 3c). All samples were collected with and stored in syringes before being analyzed for H2 using a reduced gas detector and CH4 using a flame ionization detector. Fig. 2b: mesicSphagnum Fig. 2d: fully thawed Eriophorum Fig. 2a: frozen Palsa Fig. 2c: fully thawed Carex Fig. 13: Photo of Stordalen Mire showing thawing of permafrost that has already occurred Acknowledgements: Dr. Varner for serving as my advisor, Kaitlyn Steele for serving as a mentor and Sophie Burke for running many of my samples for methane. This research was supported through the Northern Ecosystems Research for Undergraduates program (NSF REU site EAR#1063037) and the UNH Hamel Center for Undergraduate Research. Fig. 7: Depth Profile of CH₄ at Sphagnum 1 SGS site Fig. 9: Depth Profiles of CH₄ over time at Eriophorum 1 SGS site Fig. 11: Depth Profiles of CH₄ at Carex SGS site Fig. 3a: SGS array before insertion in July 2011. Photo by Kaitlyn Steele. Fig. 3b: Collecting Sipper Data at the Palsa site. Photo by Ryan Lawrence. References: Callaghan, T.V., F. Bergholm, T.R. Christensen, C. Jonasson, U. Kokfelt, and M. Johansson. 2010. A new climate era in the sub-Arctic: Accelerating climate changes and multiple impacts. Geophysical Research Letters. 37, doi:10.1029/2009GL042064 Fig. 3c: Autochamber at which measurements were taken to determine fluxes to the atmosphere. Photo by NiklasRakos