Download

1 / 69
690 likes | 711 Vues
Learn the process for developing a cost estimate, including definition, planning, and cost element structures to guide your professional opinion. Explore critical questions and purposes of estimates for successful outcomes.

E N D
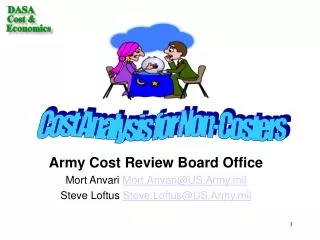
Prof. Morteza Anvari Cost Analysis for Non-Costers
Review Review Review C A B Cost Analysis Requirement MS I MS II MS III MS 0 O L D Program Definition & Risk Reduction Engineering & Manufacturing Development (EMD) Production, Fielding/ Deployment Concept Exploration Cost Estimates Needed Concept Exploration Component Advanced Development System Integration System Demo Production Readiness & LRIP Rate Production & Deployment N E W Support Concept & Technology Development System Development& Demonstration Production & Deployment Sustainment Pre-Systems Acquisition Systems Acquisition (Engineering and Manufacturing Development, Demonstration, LRIP & Production)
Cost Estimating Process Data Collect Normalize Estimate Formulation Final Document Definition Planning Review/ Presentation DOCUMENTATION
Cost Analysis Model Data/CERs LCC Estimates Cost Drivers Develop Cost EstimateStructure and WBS EstablishGround Rules and Assumptions Prepare Cost Estimatesfor Each Element Test TotalSystem Estimate Prepare Documentation Start CompileData Base/ CERs/Models Engineering Analogy Parametrics Expert Opinion Reasonableness SensitivityAnalysis Cost-RiskAssessment
Situation • You have just been tasked to develop a cost estimate, that is, a professional opinion about the cost of an item, a service or a thing. • Let’s discuss a process for organizing and developing this estimate.
Definition and Planning • Influences the success of the estimate • Understanding the requirements and how you approach the process will establish the guidelines and procedures for the estimate. • Ask lots of questions…They help you understand the requirement.
Questions • Why is this cost estimate needed? • What decisions are pending on the results of this estimate? • Will the estimate be briefed and to whom? • Will the results be incorporated into some document? • What does the recipient expect to have included or excluded? • What excursions or variations from the baseline are anticipated?
Questions Continued • What are the program and funding constraints especially if the program is a Joint Program? • What are the time constraints for this estimate? • What is the acquisition phase of the program? • Is the program definition mature? • Does technology exist today to design, develop, test and manufacture the system? • What is the interrelationship with other systems? • Are there previous contracts? How many? What type? • How have the contractors performed to date?
Definition and PlanningKnow Purpose of the Estimate • Main purposes of estimates: • Budget Formulation • Comparative Studies • Source Selection
Purpose of EstimateBudget Formulation Estimates • Program Office Estimate (POE) • Component Cost Analysis (CCA) • Independent Cost Estimate (ICE) • What-if exercises • Rough Order of Magnitude (ROM) • Should Cost Estimates • CAIV
Purpose of EstimateComparative Studies Estimates • Making cost & benefit comparisons between alternatives • Economic Analysis (EA) • Analysis of Alternatives (AoA) • Force Structure • Trade-off Studies • Source Selection • Prioritization
Definition and PlanningDefining the System • Adequate description of the technical and program characteristics of the system • What are the physical and performance characteristics? • What are the development, production, and deployment schedules? • How many systems are to be produced? • How will the systems be supported: contract, in-house, two or three levels of maintenance?
Defining the System Integrated System Schedule
Defining the System Work Breakdown Structure (WBS) • WBS definition • product-oriented breakdown of hardware, software, services, data and facilities that define the system. • WBS breaks a total job down into manageable pieces & portrays the way work is to be done. • WBS displays a company’s reporting structure. • Program managers may cite MIL-HDBK-881 “for guidance only” in contract solicitations.
Defining the System Cost Element Structure (CES) 1.0 Research Development Test & Evaluation (RDT&E) 2.0 Production 3.0 Construction (CON) 4.0 Pay and Allowances 5.0 Operating and Maintenance Army (O&M)
Defining the System COST ELEMENT STRUCTURE – 1.0 RDT&E CES#ELEMENT:FY00C$MTY$M 1.01 DEV. ENG. 1.02 PEP 1.03 DEV. TOOL. 1.04 PROTO MFG. 1.05 SEPM 1.06 SYS T&E 1.07 TRAINING 1.08 DATA 1.09 SUPP EQUIP. 1.10 DEV. FACILITIES 1.11 OTHER $ 39.039M $38.260M 0.408 0.386 0.457 0.450 110.421 107.724 78.266 76.363 11.112 10.927 1.989 1.954 3.439 3.413 4.897 4.758 0.0 0.0 0.968 0.928
Defining the System COST ELEMENT STRUCTURE – 2.0 PROCUREMENT CES#ELEMENT:FY00C$MTY$M 2.01 NON REC PROD. 2.02 REC. PROD 2.03 ENG. CHG 2.04 SEPM 2.05 SYS T&E 2.06 TRAINING 2.07 DATA 2.08 SUPP. EQUIP. 2.09 OPER./SITE/ACT. 2.10 FIELDING 2.11 TRAIN. AMMO/MSLS 2.12 WAR RESV. 2.13 MODS 2.14 OTHER $ 16.110M $ 16.583M 1,169.348 1,312.377 0.0 0.0 116.637 132.258 12.564 14.437 28.880 31.499 2.073 2.300 146.460 158.304 0.0 0.0 89.525 101.635 59.001 79.482 0.0 0.0 236.619 280.729 51.739 64.129
Defining the System COST ELEMENT STRUCTURE – 3.0 CON CES#ELEMENT:FY00C$MTY$M 3.01 DEVELOP. CONSTRUCTION 3.02 PRODUCT. CONSTRUCTION 3.03 OPERATION/SITE ACTIVATION 3.04 OTHER N
Defining the System COST ELEMENT STRUCTURE – 4.0 Pay & Allowances CES#ELEMENT:FY00C$MTY$M 4.01 CREW 4.02 MAINTENANCE 4.03 SYSTEM SPECIFIC SUPPORT 4.04 SEPM 4.05 REPLACEMENT PERSONNEL 4.06 OTHER
Defining the System COST ELEMENT STRUCTURE – 5.0 Operating & Maintenance (O&M) CES#ELEMENT:FY00C$MTY$M 5.01 FIELD MAINT., CIV LABOR 5.02 SYS. SPECIFIC BASE OPS 5.03 REPLENISHMENT DLRs 5.04 REPLEN. CONSUMMABLES 5.05 POL 5.06 END ITEM MAINTENANCE 5.07 TRANSPORTATION 5.08 SOFTWARE 5.09 SEPM 5.10 TRAINING 5.11 OTHER
Defining the System Cost Analysis Requirements Description (CARD) • Source of a system’s description • Describes important features • Is provided to other groups preparing cost estimates • Helps ensure all groups are costing out the same “program.” • Prepared by program office; approved by DoD Component Program Executive Officer
Defining the System Cost Analysis Requirements Description (CARD) Continued
Defining the System CARD Continued
Definition and PlanningGround Rules & Assumptions • State the conditions which must take place in order for the estimate to be valid • Ground rules and assumptions must be documented since changes in these areas provide an audit trail for changes in the cost estimate.
Data Collection and Analysis • Collection and analysis represent a significant amount of the overall estimating task in terms of time. The analysis will include decisions on what programs to include in the data set to whether to truncate lot data on a program for which you are calculating a learning curve. • Document data in your analysis, and any assumptions you make
Data Collection and Analysis • The direction we take in collecting historical data will be determined by our choice of estimating methodologies. • This step may also dictate a change in estimating approach due to the availability or non-availability of certain data. • Data collection is not limited to cost data. We must also collect technical and program data if we want the total picture of the historical systems. This will help us ensure the comparability of the systems that we are collecting data on with the system we are estimating.
Data Collection and AnalysisMost Difficult Task in Cost Estimating • Data Sources • Data Types: Cost/Resource, Technical, Program • Categories: Primary, Secondary • Data Problems • Wrong Format – Matching up – Definition • Temporal Factors - comparability • Normalization • Data Location
Tools for Total Ownership Cost Estimating Life Cycle Cost Management Tools
Definition and PlanningSelect the Estimating Approach • Techniques available • Analogy • Parametric • Engineering • Extrapolation • Expert Opinion Select the technique that is most applicable to a specific WBS element
Definition and PlanningEstimating Methods • Analogy • Basic Comparison • Factors • Parametric • Regression Analysis • Engineering • Detailed • Expert Opinion • Committee • Delphi
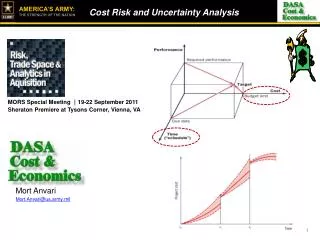
ConceptRefinement TechnologyDevelopment System Development& Demonstration Production &Deployment Operations& Support A B C D Disposal x x x x x x 0 Parametric Parametric Parametric Parametric Parametric Parametric Parametric Parametric Parametric Parametric Parametric Parametric y y y y y y y Engineering Engineering Engineering Engineering Engineering Engineering Engineering Engineering Engineering Engineering Engineering Engineering Actuals Actuals Actuals 0 0 0 z z z z Actuals x x x x x Parametric y y y y y Engineering Cost Estimating Model Actuals 0 0 0 z z Life Cycle Cost Estimates • Cost estimates based on confidence intervals • Parametric analysis based on similar systems and similar attributes (regression) • Engineering data based on reliability projections used for bottoms-up estimate • Actual system costs used to extrapolate future system costs • Cost estimate revised every two years after production • Weights associated with non-actuals decrease as system matures • MS B is a true hard stop for systems
Cost Estimating MethodsAnalogy Method • Based on direct comparison with historical information of similar existing activities, systems, or components. • Compares new system with one or more existing similar systems where there is accurate cost and technical data. • Analyst must show validity of comparison.
Cost Estimating MethodsAnalogy Method • Based on known costs of a similar program • Adjustments for complexity, technical, physical • Strengths • Based on representative experience • Less time consuming than others • Can be used as a check on other techniques • Weaknesses • Small sample size • Heavy reliance on judgment • Sometimes difficult to identify analogy and associated costs
Analogy Estimating with Factors Cost(New) = Cost(Old) x Adjustment Factor
Cost Estimating MethodsParametric Method • Known as Statistical Method or Top Down Method • Relates cost to physical attributes or performance characteristics • Uses database of elements from similar systems • Uses multiple systems • Most beneficial in earlier stages of the system or project life cycle
Cost Estimating MethodsParametric Method • Statistical relationships between cost and physical or performance parameters of past systems. • Strengths • Captures major portion of cost • Quick what if type estimates • Weaknesses • Less detailed • Getting accurate data
Cost Estimating MethodsParametric Method(Extrapolation) • Use historical values to establish a trend for the future. • Example problem: Given the actual productivity and labor rates in the given table. How much will it take to complete a 3-year software development project of 10K lines of code, if 50% is completed in the second year and 25% is completed in first and third years?
Cost Estimating MethodsEngineering Method • Known as bottom up method • Requires extensive knowledge of system characteristics • Divide into segments; estimate costs for each segment • Combine segments plus integration cost • Uses a combination of cost estimating methods • Detailed knowledge of new technologies may not be available.
Cost Estimating MethodsEngineering Method • Strengths • Detailed • Best when long stable production process • Weaknesses • Requires a lot of time • Cost • Cannot be used until system well defined
Cost Estimating MethodsExpert Opinion Method • Subjective judgment of an experienced individual or group • Use if time does not permit a more thorough analysis • Document source(s) of opinion of experts • List attributes of the source(s) Example: Delphi Technique
Cost Estimating MethodsExpert Opinion Method • Consulting with one or more experts who use their knowledge and experience to arrive at an estimate • Group techniques include • Consensus (Committee) • Delphi • Strengths and weaknesses
Expert Opinion MethodDelphi Technique • Query expert opinion from group • Seek information from each expert • Summarize the results • Send report to each expert • Gather second opinion after each individual reviews report • Summarize results • Iterative process continues until the experts reach a consensus, or near‑consensus.
Learning Curve Theory As the quantity of a product produced doubles, the man-hours- per-unit expended to produce the product decreases at a fixed rate or constant percentage (usually 10% to 15%).
Learning Curve Theory Factors Contributing to Efficiency • Job familiarization by both production workers and supervisory personnel. • Changes in product design which do not materially affect the product, but result in increased ease and speed of production. • Changes in tooling, machinery, and equipment which simplify or speed up the production process. • Improved production planning and scheduling, and improvements in production techniques and operational methods. • Improvements in shop organization, engineering coordination and liaison. • Improvements in the handling and flow of materials, and in the materials and parts supply systems
TABLE FOR FIGURESF-1-1 and F-1-2 Unit No. Unit Person-hours 1 100.00 2 80.00 4 64.00 8 51.20 16 40.96 32 32.77 64 26.21 Learning Curve Theory • The table is based on the assumption that the first unit required 100 person-hours to produce. The table indicates a constant rate of reduction of 20% for each doubling of the unit number; the value of the second and each succeeding item in the table is 80% of the value of the preceding item.
Learning Curve Theory 80% Unit Curve on Arithmetic Paper
Learning Curve TheoryUses • Evaluating contract production costs. • Assessing impact of production interruptions, product changes and production rate change. • Rate of improvement experienced by a particular contractor on a prior product may be indicative of rate of improvement expected on new product of similar size, complexity, and construction. • Improvement curve pattern experienced in the production of past item can be extended to calculate costs of future items.