Advancing Molecular Databases in Genomics and Proteomics Studies
620 likes | 691 Vues
Learn about the evolution and significance of molecular databases in genomics and proteomics research, including metagenomics. Discover how these databases aid in understanding gene structure, expression, protein interactions, and environmental microbial communities.

Advancing Molecular Databases in Genomics and Proteomics Studies
E N D
Presentation Transcript
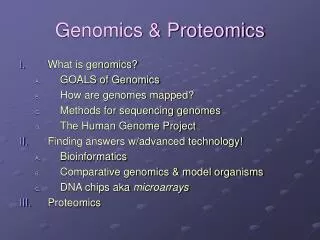
Bioinformatics • Bioinformatics involves the building and use of biological databases • Some of these databases contain the DNA sequences of genomes • Essential for mining the massive amounts of biological data for meaningful knowledge about gene structure and expression
Molecular Databases • The GenBank databases was established in 1982 in anticipating of the increasing availability of DNA sequences. • Its purpose was the collection, management, storage, and distribution of sequence data. • Initially, it was linked to the NSFnet (National Science Foundation Network.)
Molecular Databases • Increasing of large-scale projects required additional databases and the expansion of the existing databases for storing and retrieving information. • NSFnet was replaced by the Internet (World Wide Web.) • Submissions, access, and especially retrieval (data mining) became rapid and easy.
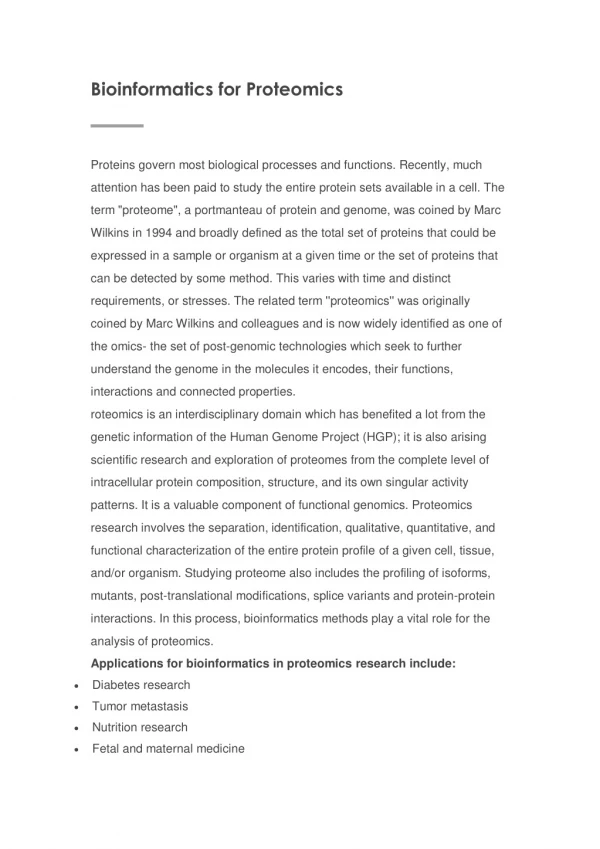
Foundation of - omics • Large-scale, whole-genome experimentation, with the analysis of many samples at one time. • Proteomics – study of entire protein population of various cell types and tissues and numerous protein-protein interactions. • As new methods were implemented and research targets become more focused, other –omics emerged, such as metagenomics, functional genomics (transcriptomics), and metabolomics.
Foundation of Genomics • The term genomics came into used with the development of large-scale sequencing in the 1980s. • Research strategies are designed based on knowledge of the complete genetic information of an organism. • Using computer to search for features in the genome or to analyze the expression patterns of tens of thousands of genes simultaneously.
Foundation of Genomics • The invention of DNA sequencing in the 1970s. • DNA sequence information in the GenBank database rose rapidly. • The genomic sequence data drove the design of new experiments and interpretation of gene function and of molecular processes in the cell. • The genomic sequence data drove the design of new experiments and interpretation of gene function and of molecular processes in the cell.
Metagenomics • Identification, characterization of biological functions of microorganisms required cultivating of each strain in the laboratory. • In the 1990s, DNA can be directly extracted from environmental samples, such as soil and sea water. • Researcher began to examine the sequence diversity of microorganisms using the universal 16S ribosomal RNA gene as taxonomic marker. • It is revealed that less than 1 % of bacteria species could be cultured.
Metagenomics • The study of the collective genomes in the environmental samples is known as metagenomics. • The primary objective of a metagenomic project is to construct a comprehensive DNA library from all the microorganisms of a particular system or location. • The metagenomic clones can be characterized in various ways, such as shotgun sequencing strategy. • Metagenomic project is supported by development of high-efficiency cloning, robotic work stations, inexpensive DNA sequencing, databases, and bioinformatics resources.
Metagenomics • A massive study including 50 ocean samples yielded 6.3 x 10⁹ bases of sequence. • Analysis of the sequences indicated that there might be as many as 400 new bacterial species. • The analysis also revealed sequences encoding potentially novel forms of many proteins, including proteins for repair of UV light-induced DNA damage and RuBisCO. • Sequence-based metagenomic projects are especially effective with microbial communities that have relatively few species.
Metagenomics • The toxic runoff often continues long after the mining operation has been abandoned. • It is interesting to learn more about the metabolic pathways of the microorganisms found in these environments and how they survived under such conditions. • In one metagenomic study, the nearly complete genomes of two major bacterial species and partial genomes of three other microbes were cloned and assembled. • Leptospirillum group III plays a critical role in fixing atmospheric nitrogen in this environment.
Metagenomics • Metagenomic libraries are frequently screened for enzyme activity to identify novel enzymes with biotechnological potential. • Selection for growth of transformed E. coli cells on particular substrates, complementation tests, and, most often, simple indicator systems are used for these studies. • A metagenomic library was screened for cloned lipase genes by growing transformed cells on agar plates that were supplemented with various triglyceride substrates, such as tricaprylin. • The halo indicated that the colony produced and secreted an enzyme that digested tricaprylin.
Metagenomics - Limitation • Selection schemes depends on transcription and translation of the cloned gene in the host cell, E. coli. • Based on computer modeling using codon usage and other transcription and translation features from the genes of many different organisms suggests that only 40% of the heterologous genes will be expressed in E. coli. • Broad-host-range vectors and other host cells are being used for constructing and maintaining metagenomic libraries. • Specialized gene expression systems aid in detecting metagenomic clones that carry genes with certain functions.
Metagenomics - SIGEX • SIGEX – substrated-induced gene expression. • This procedure identifies catabolic genes that are expressed when their promoters are activated in the presence of particular substrates. • It also relies on the cloning of regulatory elements that are often found upstream of the catabolic genes that they control. • The system utilizes a vector that contains the green fluorescent protein (gfp) gene under the control of lac promoter (plac) in a pUC-based plasmid, designated p18GFP.
Metagenomics - SIGEX • The cloning site lies between the lac promoter and the gfp gene. DNA from a microbial community is fragmented and cloned into p18GFP. • The cells are grown in selective media containing ampicillin, to prevent the growth of untransformed cells, and IPTG to induce the expression of gfp gene from the lac promoter. • Cells that produced green fluorescent protein in the presence of IPTG are those that carry plasmids without inserts, plasmids with inserts that do not prevent transcription of gfp from the lac promoter (no transcriptional terminator), or plasmids with inserts containing constitutively active promoters.
Metagenomics - SIGEX • The cloning site lies between the lac promoter and the gfp gene. DNA from a microbial community is fragmented and cloned into p18GFP. • The cells are grown in selective media containing ampicillin, to prevent the growth of untransformed cells, and IPTG to induce the expression of gfp gene from the lac promoter. • Cells that produced green fluorescent protein in the presence of IPTG are those that carry plasmids without inserts, plasmids with inserts that do not prevent transcription of gfp from the lac promoter (no transcriptional terminator), or plasmids with inserts containing constitutively active promoters.
Metagenomics - SIGEX • Transformed cells of interest are those that do not produce green fluorescent protein in the presence of IPTG because they carry plasmids with inserts that do not include expression of gfp under these conditions. • The transformed cells are subjected to fluorescent-activated cell sorting (FACS) to remove cells that produce green fluorescent protein. • These cells will fluoresce green when exposed to blue light and are separated from the cells that do not synthesize green fluorescent protein, and therefore, do not fluoresce.
Metagenomics - SIGEX • The gfp-negative cells are then grown in the presence of a low-molecular weight substrate, for example, benzoate. • A second round of FACS is carried out, and the cells that expressed green fluorescent protein in the presence of substrate are retained. • These cells contain substrate-inducible regulatory elements. The inserts are analyzed to identify full or partial sequences encoding catabolic enzymes. • Additional experiments may be required to isolate entire catabolic operons.
Functional Genomics • Completion of genomic sequences of many organisms led to new experimental tools to study the functions of genomes on a large scale. • “High-throughput biology” includes microarray, large-scale genetic analysis, methods for identifying and assaying huge numbers of DNA sequence variants. • These evolving methods advanced the studies of protein-DNA and protein-protein interactions, cis-acting transcriptional regulatory sequences, the location of mRNAs in cells and tissue, and protein expression levels.
Dot blot hybridization • Dot blot hybridization has been developed to determine the presence, absence, or relative amounts of a gene or its mRNA in a cell. • DNA fragments are denatured and then attached to a filter in a simple array either by manual spotting or by using an inexpensive apparatus. • DNA or mRNA from a biological sample is labeled and then hybridized to the filter, just as in Southern blot, to determine whether the sequence is present. • However, it did not provide the scale required to cope with the flood of sequences.
Microarrays • In the early 1990s, scientists developed microarrays for hybridizing tens or even hundreds of thousands of nucleic acid fragments in a single experiment. • The principle is similar to that of dot blot, but instead of just a few dozen dots of DNA, several million different DNA fragments are deposited in an ordered array on a glass slide using automated methods. • It can be used to analyze the transcript levels as well as the copy number of essentially all the genes from an organism, genotyping the millions of DNA sequence variants, and identifying the genomic DNA segments bound by proteins in the cell.
Making Microarrays • A quartz wafer of the kind used to make computer chips is treated with a photolabile chemical that prevents nucleotides binding to the surface. • A photolithographic mask is overlaid on the chip and illuminated. The holes in the mask correspond to the position on the chip where the first nucleotide is to be added (in this case, adenosine.) • The light destroys the blocking chemical and adenosine is added so that it binds to the unprotected locations and they are once again protected. • Three different masks are used in turn to deprotect the positions for thymidine, guanosine, and cytidine.
Making Microarrays • Three different masks are used in turn to deprotect the positions for thymidine, guanosine, and cytidine. • At this stage, the first position of every oligonucleotide - about one million – on the chip has been put in place and all carry a blocking group. • The process is repeated for the four nucleotides that will occupy the second place in the oligonucleotide. • By the end of the second cycle, there are dinucleotide chains at every location. • This cycle of reproduction and addition of a nucleotide is repeated until the array carries oligonucleotides of 20-25 nucleotides in length.
Microarrays • For this type of microarray, the probes are typically 10 to 40 nucleotides, and several probes with different sequences for each gene will be synthesized on the microarray. • Longer oligonucleotides up to 100 nucleotides can also be used. • A complete whole-genome oligonucleotide array may contain more than 500,000 probes representing as many as 30,000 genes. • The design of the probes (probe set) for a microarray depends on the objective of the experiment and the degree of resolution that is required.
Microarrays • Computer programs determine probe sequences that are specific for their target sequences, are least likely to hybridize with nontarget sequences (cross-hybridize). • These probes have no secondary structure (foldback) that would prevent hybridization with the target sequence. • They have similar melting (annealing) temperatures , so that all target sequences can bind to their complementary probe sequences under the same conditions.
Gene Expression Microarrays • The gene expression microarrays contain a set of 22 different oligonucleotides (25-mers) for each gene to be tested. • Eleven of the 25-mers have the exact sequence of different segments of the mRNA transcribed from the gene. The other 11 are identical except for an incorrect base at nucleotide number 13. • The 11 mismatched oligonucleotides help to establish the background signal for each correct oligonucleotide in the hybridization step. • These signals are subtracted from the signals of each of the perfectly match during the data analysis.
Gene Expression Microarrays • The mRNAs to be measured are fragmented and the fragments are labeled with a fluorescent dye. • In some experiments, the mRNAs are directly labeled or are made into cDNA and then labeled. • The microarray is bathed with the labeled mixture and each mRNA fragment finds its complementary mate at a feature on the microarray. • After hybridization and washing, the microarray is placed in a special detector, which scans and measures the amount of fluorescent signal. • The amount of the signal is corresponding to the amount of each mRNA being studied.
Gene Expression Microarrays • mRNA is extracted from two samples (sample 1 and sample 2), and during reverse transcription, the first cDNA strands are labeled with fluorescent dyes (Cy3 and Cy5, respectively. • The cDNA samples are mixed and hybridized to an ordered array of either gene sequences or gene-specific oligonucleotides. • Probe cells that produce only a green or red emission represent genes that are transcribed only in sample 1 and 2, respectively. • The yellow emissions denote genes that are active in both samples, and black represent genes that are not transcribed in either sample.
Gene Expression Microarrays • mRNA is purified with a poly(dT) sequence that has a T7 RNA polymerase primer sequence extension. • After two-stranded cDNA synthesis, the second cDNA strand acts aas a template for synthesis of cRNA by T7 RNA polymerase in the presence of biotinylated CTP and UTP. • The biotynilated cRNA is purified, fragmented into pieces from 50-100 nucleotides in length, and hybridized to an oligonucleotide microarray. • The microarray is treated with streptavidin-phycoerythrin, and the probe cells are scanned for emission (yellow) from the biotin-bound streptavidin-phycoerythrin.
Spotted cDNA Microarrays • The cDNA clones are generated using plasmid library and sequences are available from the expressed sequence tag (EST). • PCR is used to amplify the cDNA inserts, and the double-stranded DNA fragments are denatured and then “spotted” onto a glass microscope slide. • The DNA fragments on the array are large (several hundred to several thousand base pairs), hybridization is more specific so that only one feature per gene is needed. • A single spotted cDNA microarray can assay all the genes in an organism.
Spotted cDNA Microarrays • The “two-color” experiment design is used to determine the set of genes that are expressed in higher level in different tissue. • Two different sets of complex mRNA sample are used. • Each set, a control and the test sample, are labeled separately with a different fluorescent label, usually Cy3 (green) or Cy5 (red.) • The two labeled samples are mixed together and hybridized to the microarray. • The ratio of the amounts of each mRNA in the experimental to control samples is determined by relative fluorescent level at each spot.
mRNA Profiling Reveals New Relationship • Microarrays can examine the expression of thousands of genes following different treatments at multiple time points. Extensive statistical analysis and innovative ways of displaying data are needed. • Genes are ranked in a table according to how similar their gene expression levels are in a single experiment or across different experiments in different cell types or under different physiological conditions. • The “heat-map” is produced, in which each data point is shown as a shade of green or red or other pairs of colors.
Positive log ratios represent more Cy5 than Cy3 and, therefore, greater expression of the gene in the test sample than in the reference sample. • Negative values (more Cy3 than Cy5) indicate a lower level of expression in the test sample than the reference sample. • Red denotes over-expression and green denotes under-expression.