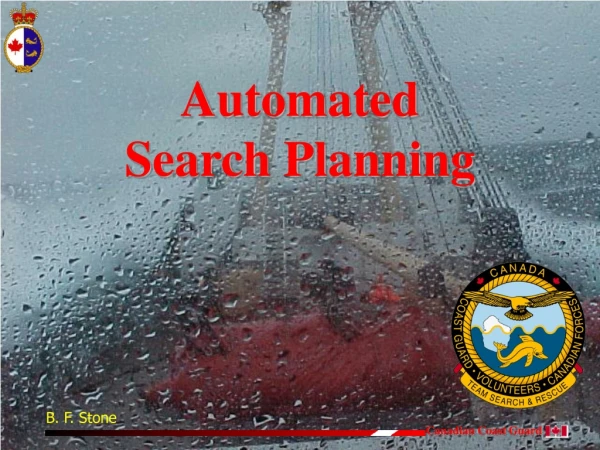
Automated Search Planning
160 likes | 280 Vues
Automated Search Planning. B. F. Stone. SAR Statistics. 8000 cases 1100 of these would be classified as distress incidents 3000 lives saved 80 lives lost 21,000 persons assisted. Canada’s Search Effort.

Automated Search Planning
E N D
Presentation Transcript
Automated Search Planning B. F. Stone
SAR Statistics • 8000 cases • 1100 of these would be classified as distress incidents • 3000 lives saved • 80 lives lost • 21,000 persons assisted
Canada’s Search Effort • The Canadian Aeronautical and Maritime SAR system averaged a total of 4,300 hours* per year of actual searching • The time spent searching over the last decade totals a staggering amount of over 47,300 hours - the equivalent of almost 5 years of search effort for a single unit *This does not include transit times to and from an incident
Effectiveness • 92.7 of all lives at risk were saved • Only 9 percent of all search and rescue (SAR) cases involved some sort of searching • 75% of all incidents involving the loss of life involved some sort of attempt to locate the distressed persons
Success • Typically if one is searching for something, success is achieved when it is located • If we were to use this measure of success alone, Canada achieved this 91% of the time • In the SAR world, success is only achieved when we find the search targets AND they are rescued, alive and well • Using this measure of success Canada only achieved a success rate of 79% when we were required to search
Cost • Using variable costs (fuel and proportional O&M) of each unit searching we can estimate the expenditure that was required in 2003 to conduct the searches.
CANSARP Winds CANSARP SLDMB Communications Interface Unit Drift Model Effort Allocation Currents Tides User Interface Vessel Position Reports
Search Theory Wind Driven Current Sea Current Total Water Current Leeway Divergence Total Drift Vector Search Radius LKP Datum Minimax
Self-Locating Datum Marker Buoy GPS ARGOS LUT SLDMB Rescue Centre CANSARP
MERSEA & MERCATOR 2001 High-resolution 1/15° : one point processed every 5 to 7 Km 1/3o 1/15o 2002 2o 1/15o 2005 Global low-resolution North Atlantic High Resolution 1/4o Medium-resolution Atlantic 1/3° : one point processedevery 35 Km Target system: Global Ocean and High Resolution
Global Environmental MultiscaleAtmospheric Model (GEM) • Short-range regional forecast model • 48 hour forecast twice daily (00 UTC and 12 UTC) • Operational since Sept. 15 1998 • Regional Variational Assimilation System • Operational since Sept. 24 1997 • High resolution Model Applications Project: • 10 km - 35 Levels - 24 hour forecast • Experimental/operational since Oct. 24 1997
Earth Observation • Targets • Ocean currents • Winds
Any investment in the technology for the definition of where, and how to search would result in the reduction of time, costs and ultimately increase the saving of lives Less Search, More Rescue