Download
1 / 21
290 likes | 728 Vues
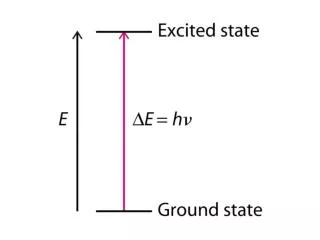
Interpreting IR and NMR spectra. Interpreting IR. The Fingerprint Region

E N D
Interpreting IR The Fingerprint Region • The fingerprint region is the region between 500-1500cm-1. It is very difficult to identify specific IR absorbance in this region. However it is very important in identifying between structural isomers. as shown in the following slides
Interpreting IR Propan-1-ol Propan-2-ol
Interpreting NMR Low Resolution Proton NMR There are three key pieces of information that can be gained from low res proton NMR • number of proton environment (number of peaks on the spectra) • peak ratio (the ratio of hydrogens in the groups) • chemical shift (the movement caused by the type of group present)
Example of Low Resolution NMR • Number of peaks = 3 therefore 3 proton environments (not methyl ethanoate) • Peak Ratio 1:2:3 (again not methyl ethanoate) • Peak at ~12 carboxylic acid - the compound is propanoic acid Which of the following compounds relates to the low res NMR below
Interpreting NMR High Resolution NMR High resolution NMR gives us the same information as low res NMR but it also tells us the number of hydrogens on adjacent carbons. The number of peaks shown on a high resolution NMR is one more than the number of hydrogens on adjacent carbons. The exception to this is when all adjacent hydrogens are equivalent then there is no splitting
Interpreting NMR • Carbon 13 NMR • Carbon 13 NMR gives us less information than proton NMR, however it is often used alongside proton NMR to identify compounds that have similar proton NMR spectra. • Carbon 13 NMR identifies types of Carbons based on chemical shifts.
More NMR examples • http://www.chem.ucla.edu/~webspectra/ • http://home.clara.net/rod.beavon/spectra.htm