Download
1 / 28
290 likes | 415 Vues
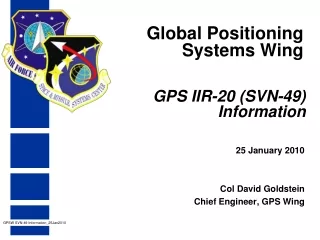
SVN-49 Signal Anomaly. Presented by Tom Stansell GPSW POC: Lt. Col. James Lake, Ph.D. Introduction. GPS IIR-20, SVN-49 (PRN 01), carries an L5 Demonstration Payload The L5 signal was not for operational use The intent was to “bring L5 into use” for ITU purposes

E N D
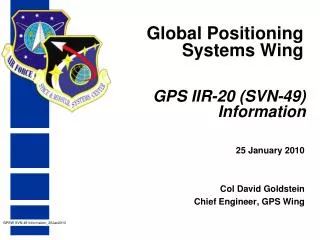
SVN-49 Signal Anomaly Presented by Tom Stansell GPSW POC: Lt. Col. James Lake, Ph.D.
Introduction • GPS IIR-20, SVN-49 (PRN 01), carries an L5 Demonstration Payload • The L5 signal was not for operational use • The intent was to “bring L5 into use” for ITU purposes • The demonstration payload made use of an Auxiliary Payload port on the spacecraft • No impact on the L1 and L2 signals was intended or expected • However, 2SOPS and Aerospace reported unusually high and elevation angle dependent Pseudo Range Residuals (PRR) from the monitor stations
Pseudorange Residuals • Ionospheric refraction corrected pseudoranges • Relative to a “best fit” orbit determined early in the test program • Roughly a 4+ meter spread from 10 to 80 degrees
GPS IIR Antenna Farm L-Band Antenna Array with 12 Helical Antennas
Outer Ring Inner Ring L-Band Antenna Element Locations
L5 Filter 162 In. Cable Antenna Coupler Network Outer Ring Inner Ring
Max Code Error w/Same Polarity Max Code Error w/Opposite Polarity Early Minus Late Tracking P Code Correlator 293 M
Ionospheric Refraction Calculation Ionospheric correction amplifies code noise
Early Minus Late L1 P(Y) Code Track Error Opposite Phase Same Phase Iono Correction Factor
Useful Observation • Receivers with early minus late correlators having similar spacing will have essentially the same tracking error for all signals at one frequency • e.g., L1 P(Y) and L1 C/A exhibit the same error • However, different types of correlators and different correlator spacings very likely will produce different tracking errors • See next slide with figures from 13 July ’09 GPS World Article
Tracking Error with Different Correlators L1 Typical Semi-Codeless Correlator L2 Typical Semi-Codeless Correlator L1 Using Multipath Mitigation w/ 20 nanosecond correlator spacing L2 Using Multipath Mitigation w/ 20 nanosecond correlator spacing Figures courtesy of GPS World, receivers are JAVAD GNSS Triumph receivers
Early Minus Late L2 P(Y) Code Track Error Opposite Phase Same Phase Iono Correction Factor
Refraction Corrected Error Possibilities • Assume the direct and reflected L1 signals are in phase so at zenith the L1 pseudorange is 1.62 m too long • If the direct and reflected L2 signals are in quadrature, the L2 pseudorange error is negligible • Therefore, the refraction corrected pseudorange error is (2.55 x 1.62 – 1.55 x 0) = 4.14 m • If the direct and reflected L2 signals are in the same phase, the L2 pseudorange error is ~0.95 m • Therefore, the refraction corrected pseudorange error is (2.55 x 1.62 – 1.55 x 0.95) = 2.66 m • If the direct and reflected L2 signals are in opposite phase, the L2 pseudorange error is ~ -1.1 m • Therefore, the refraction corrected pseudorange error is (2.55 x 1.62 – 1.55 x –1.1) = 5.84 m
A Partial Fix • In order to reduce the elevation-dependent tracking residuals, 2SOPS has experimented with placing the antenna phase center about 152 meters above the satellite rather than slightly below as normal • (How can you fix a 4-5 meter problem with a 152 meter solution?) • The Kalman filter then provides orbit and clock parameters which best fit the tracking data • The key parameter is clock offset • Over the next few weeks, different values will be tried and transmitted in the NAV messages
If Rs effective = Rs + The impact on pseudorange is cos(b) The following plot shows the effect of = 152.586 m with a clock offset of 496.2 nsec (148.754 m) Raise the Orbit, Offset the Clock
Spirent Simulation • Note for organizations with a Spirent simulator • Spirent is preparing a scenario, based on these models, to simulate the SVN-49 problem and enable laboratory testing • The scenario provides normal L1 and L2 signals plus a delayed signal with the proper relative amplitude and phase relationships as a function of elevation angle in accordance with these models • Several parameters can be modified by the operator • The scenario will available directly from Spirent by request