Download

1 / 13
130 likes | 270 Vues
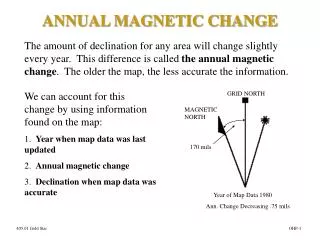
The Change of Magnetic Inclination Angles Associated with Flares. Yixuan Li April 1,2008. BACKGROUND.

E N D
The Change of Magnetic Inclination Angles Associated with Flares Yixuan Li April 1,2008
BACKGROUND • Recent white-light observations demonstrated a consistent pattern of changes in sunspot structures: part of the penumbral segments in the outer spot decays rapidly after flares, and meanwhile, the umbral cores and/or inner penumbral regions are enhanced.
X10 flare on 2003 October 29 Sunspot Structure Change (Liu et al. 2005) (a) and (b) are TRACE WL images of preflare and postflare states, respectively. (c) is the WL difference image (the postflare image minus the preflare image)
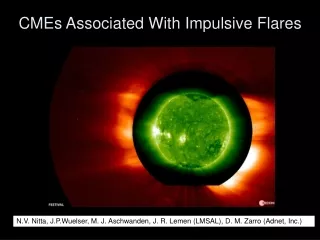
X8.3 flare on 2003 November 2 X17 flare on 2003 October 28 X2.3 flare on 2000 June 6 X5.6 flare on 2001 April 6 M7.9 flare on 2001 April 9 X5.3 flare on 2001 August 25 The difference images for all the seven events show a very similar pattern with a bright (decaying) region outside and a darkening in the center.
Hinode G-band observations reveal similar changes (Jing et al.) The intensity in RG1 decreases by ~12% within the interval of two time bins while the intensity in RG2 increases by ~7%. These changes denote the enhancement of inner penumbra near the magnetic PIL and the decay of the peripheral penumbra, respectively. Top row: Hinode G-band images and their difference image (right). Bottom panel: Normalized time variation of the total G-band intensities in area RG1 and RG2 The dotted vertical curve indicates the peak time of the flare non-thermal emission.
Reconnection Picture (Liu et al. 2005) • The two spots become strongly connected after the flare, leading the penumbral fields to change from highly inclined in the preflare state to a more vertical configuration after the flare. This accounts for the penumbral decay. • The umbra becomes darker as a result of an enhanced longitudinal magnetic field. The strong connection between the two spots also leads to a substantial increase in the transverse field in the central δ spot region, which can explain the darkening of the inner penumbra. The gray and black lines stand for penumbral and umbral fields, respectively.
Bx By Bz 2006-12-12 20:30 before flare 2006-12-13 04:30 after flare Hinode Spectropolarimeter (SP) magnetogram of AR 10930 • the X3.4 Flare on December 13 2006
2006-12-13 01:00 2006-12-13 04:36 Enhance Region G-band Image Difference image Decay Regions
Angle Distribution for the Penumbral Decay Regions 2006-12-12 2006-12-13
Angle Distribution for the Inner Penumbral Region 2006-12-12 2006-12-13
the Hinode Spectropolarimeter (SP) have taken several strong flares, including three X-class flares: • X6.5 on December 6, 2006 • X3.4 on December 13 , 2006 • X1.5 on December 14 , 2006 …… • Solar atmospheric condition measurement changes associated with flares in both peripheral and inner penumbral regions • Temperature • Density ……