
Analyzing CapG Expression in Oral Squamous Cell Carcinomas and Oral Potentially Malignant Lesions
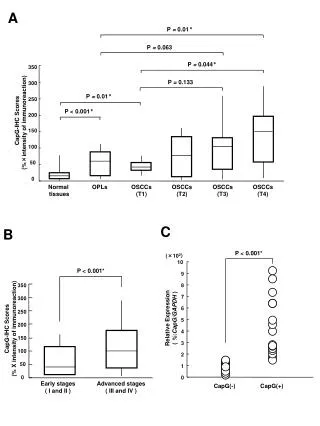
This study evaluates the expression of CapG in various stages of oral squamous cell carcinomas (OSCCs) and oral potentially malignant lesions (OPLs). Findings reveal significant differences in CapG expression among healthy tissues and malignancies, with marked distinctions between early (T1 and T2) and advanced (T3 and T4) stages. The analysis employs immunohistochemistry, revealing a strong correlation between CapG levels and tumor progression, suggesting its potential role as a biomarker in assessing OSCC and OPL severity.

Analyzing CapG Expression in Oral Squamous Cell Carcinomas and Oral Potentially Malignant Lesions
E N D
Presentation Transcript
350 300 250 350 300 200 250 200 150 150 Normal tissues OSCCs (T1) OSCCs (T2) OSCCs (T3) OSCCs (T4) OPLs 100 100 50 0 50 0 10 9 8 7 6 5 4 3 2 1 0 A P = 0.01* P = 0.063 P = 0.044* P = 0.133 P = 0.01* P < 0.001* CapG-IHC Scores (%×intensity of immunoreaction) C B P < 0.001* (×102) P < 0.001* Relative Expression ( %:CapG/GAPDH ) CapG-IHC Scores (% X intensity of immunoreaction) Early stages ( I and II ) Advanced stages ( III and IV ) CapG(-) CapG(+)