Download
1 / 16
160 likes | 288 Vues
Examine causal relationship between stock prices of Taiwan Semiconductor Manufacturing Company and Uni-President Enterprises using Vector Autoregressive Model (VAR). Data analysis includes unit root tests, co-integration tests, and Granger Causality tests. Discover co-integration phenomenon and implications for asset allocation strategies.

E N D
The Price Relationship Study of Stock You-ShengLiu 2011/01/04
Outline 1. Motivation 2. Proposed method 3.Data analysis 4. Conclusions
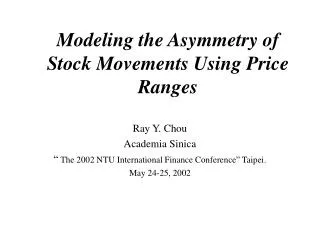
Motivation & Introduction • Because I’m doing on the asset allocation between the stock price in my thesis, I want to know each other impact between. • Prior to the classroom with the AR model can only know the current relationship with the previous period. • This article by Vector Autoregressive Model (VAR) to explore Taiwan Semiconductor Manufacturing Company (TSM)、Uni-President Enterprises Corporation(UPE)of the causal relationship.
Proposed method VAR model Granger Causality test data 1.unit root test 2. co-integration test VEC model
Data • Data: Daily closing price from 2007.1 to 2009.12
Co-integration test • What is co-integration? Engle and Granger(1987) proposed statistical model, the definition is linear combination of non-stationary time series become stationary ,then we say that the time series of “Cointegration”phenomenon. • Method: Engle and Granger (1987) proposed a two-stage cointegration test method to be used to determine the non-stationary time series of the cointegration property. The following steps test (一)Using unit root test for the time series data, conducted to determine the non-stationary time series. (二)Using unit root test for residual term. This means taht
VAR model Suppose we have 2 time series , i = 1,2 , m,and t = 1, . . . , T. Then a vector autoregressionmodelis defined as In matrix notations
VEC(vector error correction )model In matrix notations The previous period error term of the cointegration model
Granger Causality test : X does not cause Y (Or : β1 =β2 = …. = βm = 0; from the following model: Yt= Σαi Yt-i+ Σβi Xt-i+εt )
Data analysis Unit root test: Co-integration test:
Data analysis The choice of lag: Parameter estimate:
Data analysis : Y does not cause X : X does not cause Y
Conclusions 1.The model fit: 2. So when I was doing asset allocation, I would have taken into account these two stocks.
Reference • 台灣證劵交易所: http://www.twse.com.tw/ch/