
Apply Anthropometric Data for Human-Centered Design
E N D
Presentation Transcript
Engineering Anthropometry Pengantar Ergonomi
A need for Human Centered Design • Human physical variation • Design optimization • Safety concern • Health concern
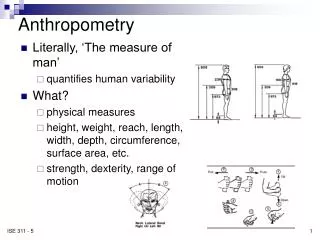
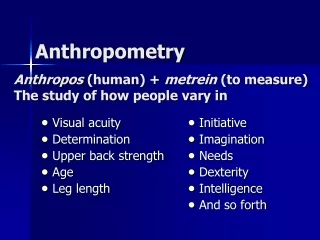
Anthropometry as a Science • Engineering anthropometry is a branch of science originating from anthropology that attempts to describe the physical dimensions of the (human) body. • Can be separated into: • Physical (Static) anthropometry – which addresses basic physical dimensions of the body. • Functional anthropometry – concerned with physical dimensions of the body relevant to particular activities or tasks.
Applications • Tools design • Consumer product design • Workplace design • Interior design
Factors Affecting Anthropometrical Variation Age Gender Race & Ethnic Socio-economics Occupation Life style
Sample Anthropometric Data From Chaffin, DB et al (1999) Occupational Biomechanics, Table 3.10
Anthropometrical Design Procedures • Determine dimensions of product which are critical for design (considering effectiveness, safety and comfort) • Determine the related body dimensions • Select user population (who will use the product or workplace) • Conduct reference study to find secondary data, if available (considering population characteristics) or conduct measurement • Select percentile
Percentile • Commonly used: 5th, 95th, 50th (median) • Lower-limit dimension: the smaller the system, the more unusable by the largest user Use high percentile • Upper-limit dimension: the bigger the system, the more unusable by smallest user Use low percentile
Sample Anthropometric Data From Chaffin, DB et al (1999) Occupational Biomechanics, Table 3.10
Anthropometric Data: Populations • Means () and standard deviations () are typically reported for anthropometric data (often separated by gender) • Use of these value implicitly assumes a Normal distribution. Assumption is reasonable for most human data. • Percentiles can easily be calculated from mean and std.dev. using these formulas and/or standard statistical tables (usually z).
Standard Normal Variate • Z = (y-)/ • Normally distributed with mean = 0 and variance = 1 • z is N(0,1) • From tables of normal cumulative probabilities • P{z≤z(A)} = A • Example: if zA = 2, A = 0.9772 (two std.dev. above mean is the 97.7%-ile) • Properties of z: • zA > 0; above mean (>50%-ile) • zA = 0; at mean (50%-ile) • zA < 0; below mean (<50%-ile)
Percentile Example • For female stature (from Table) • = 160.5 cm • = 6.6 cm • What female stature represents the 37.5th %-ile? • From normal distribution: z(37.5%) = -0.32 Thus, X(37.5%) = + z = 160.5 - (0.32)(6.6) = 158.4 cm
Anthropometric Data: Variances • To combine anthropometric dimension, need to calculate a new distribution for the combined measures, accounting also for the covariance (Cov) between measures (M = mean; S = std. dev.): MX+Y = MX + MY SX+Y = [SX2 + SY2 + 2Cov(X,Y)]1/2 SX+Y = [SX2 + SY2 + 2(rXY)(SX)(SY)]1/2 MX-Y = MX - MY SX-Y = [SX2 + SY2 - 2Cov(X,Y)]1/2 SX-Y = [SX2 + SY2 - 2(rXY)(SX)(SY)]1/2 • Means add, variances do not!
The “Average Human” • Anthropometric data for individuals is often estimated using stature or body weight in linear regression equations. • Ex: average link lengths as a proportion of body stature • Advantages: • Simplicity • Disadvantages: • relationships are not necessarily linear, nor the same for all individuals • Values represent averages for a portion of a specific population
H here is stature What is 95th%-ile arm length? 0.186H + 0.146H = 0.332H H is 95th%-ile stature The “Average Human” From Chaffin, DB et al. (1999) Occupational Biomechanics, Fig 3.9
Anthropometry in Design • Anthropometric data is most often used to specify reach and clearance dimensions. • The criterion values most often used: • Reach: 5% Female • Clearances: 95% Male • Try to accommodate as large as possible user population within constraints
Design Approaches • Design for extremes • emphasize one 'tail' of distribution • Design for average • emphasize the center of a population distribution • Design for adjustability • emphasize that all potential users/consumers are 'equal’ • Varying ranges of accommodation: • 5th-95th %ile: typical • 25th-75 %ile: less critical functions or infrequent use • 1st - 99th %ile: more critical functions +/- low $ • 0.01 - 99.99 %ile: risk of severe outcomes
Design for Extremes • Example: Door Height • Assuming a normal distribution • z = (X - )/ • Obtain z => %-ile from stats table • What height to accommodate? (95th%-ile male) • = 69”; = 2.8” (from anthropometric table) • z0.95 = 1.645 = (X - 69)/2.8 => X = 73.6” • Additional allowances? • Hair • Hats and shoes • Gait • Etc.
Examples Which design strategy should be employed? • leg clearance at a work table • finger clearance for a recessed button • height of an overhead conveyor system • grip size for a power tool • weight of a power tool • height of a conveyor • strength required to turn off an emergency valve
General Strategies and Recommendations • Design for Average: • Usually the worst approach: both larger and smaller users won’t be accommodated • Design for Extremes: • Clearance: use 95th percentile male • Reach: use 5th percentile female • Safety: accommodate >99% of population • Design for Adjustability • Preferred method, but range and degrees of adjustment are difficult to specify