AP Mechanism – Lab #11
80 likes | 193 Vues
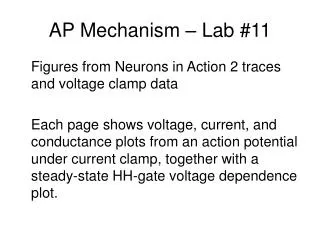
This lab report presents figures illustrating neuronal action potentials through voltage, current, and conductance plots. It includes detailed traces from an action potential recorded under current clamp conditions, highlighting key phases: resting membrane voltage at -65mV, initial depolarization to -50mV, rising phase peaking at 0mV, and a depolarization peak of +50mV. The analysis also covers the falling phase returning to 0mV, hyperpolarization overshoot to -75mV, and the restoration to resting potential. The steady-state Hodgkin-Huxley gate voltage dependence is also depicted.

AP Mechanism – Lab #11
E N D
Presentation Transcript
AP Mechanism – Lab #11 Figures from Neurons in Action 2 traces and voltage clamp data Each page shows voltage, current, and conductance plots from an action potential under current clamp, together with a steady-state HH-gate voltage dependence plot.
Rest Vm = -65mV
Initial Depolarization Vm = -50mV
Rising Phase Vm = 0mV
Depolarization Peak Vm = +50mV
Falling Phase Vm = 0mV
Hyperpolarization Overshoot Peak Vm = -75mV
Rest Vm = -65mV