Download
1 / 32
320 likes | 466 Vues
Climate Change, the Sun and Greenhouse Gases by K.K. Tung Department of Applied Mathematics. Chapter 8: Snowball Earth and Global Warming

E N D
Climate Change, the Sun and Greenhouse Gases by K.K. Tung Department of Applied Mathematics
Chapter 8: Snowball Earth and Global Warming 8.1 Introduction 1268.2 Simple ClimateModels 128Incoming Solar Radiation 129Albedo 130Outward Radiation 130Ice Dynamics 132Transport 132TheModel Equation 1338.3 The Equilibrium Solutions 134Ice-Free Globe 135Ice-Covered Globe 136Partially Ice-Covered Globe 137Multiple Equilibria 1388.4 Stability 139The Slope-Stability Theorem 140The Stability of the Ice-Free and Ice-Covered Globes 141Stability and Instability of the Partially Ice-Covered Globe 141How Does a Snowball Earth End? 1438.5 Evidence of a Snowball Earth and Its Fiery End 1448.6 The GlobalWarming Controversy 1468.7 A Simple Equation for Climate Perturbation 1508.8 Solutions 153Equilibrium GlobalWarming 153Time-Dependent GlobalWarming 154Thermal Inertia of the Atmosphere-Ocean System 1558.9 Exercises 157
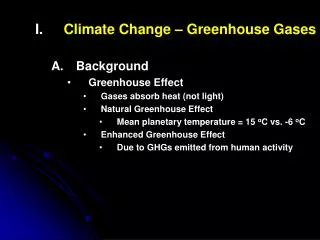
“As constant as the sun”? • Distant Past: One billion years ago, our sun’s radiation is about 6% weaker. Snowball Earth. Glacier at sea level in the tropics. Four such episodes, each lasting 10 million years. The end of last one 600 million years ago led to the “Cambrian Explosion” of multicellular life forms. • Recent Past: Naked eye and telescope observation of the sun’s surface. 11th-12th century, Medieval Maximum, Vikings colonies flourished in Greenland. Late 17th century, Maunder Minimum, Little Ice Age in Europe and North America. • *Present: Satellite measurement of the changes in the solar constant. Detection of the atmosphere-ocean’s response to solar variability. Proposed mechanism of how the Earth’s climate responds to variations of solar radiation. • *Future: Predictions of global warming. How much of the warming is caused by the greenhouse gases, and how much by the sun?
Importance of Ice-Albedo Feedback • Ice covered surface reflects more sunlight back to space, less solar energy received, hence colder. Then glaciers advance more equatorward. • The reverse: In a warmer climate, more ice melts, exposing darker surface underneath, which absorbs more solar radiation, hence warmer, and more ice melts. Glaciers retreat.
“As constant as the sun”? • Distant Past: • Recent Past: Naked eye and telescope observation of the sun’s surface. 11th-12th century, Medieval Maximum, Vikings colonies flourished in Greenland. Late 17th century, Maunder Minimum, Little Ice Age in Europe and North America. • *Present: Satellite measurement of the changes in the solar constant. Detection of the atmosphere-ocean’s response to solar variability. Proposed mechanism of how the Earth’s climate responds to variability of solar radiation. • *Future: Predictions of global warming. How much of the warming is caused by the greenhouse gases, and how much by the sun?
Until recently the variability of the solar radiation was not measured directly, but sunspot Observation has a long history. “You are mistaken, my son. I have studied Aristotle and he nowhere mentions spots. Try changing your spectacles.” Sunspots and Faculae
Past reports of solar-weather connection • Pittock (1978) reviewed many such reports. None can be shown to be real. • 1600s, cold temperatures were associated with sunspots. • 1676, Robert Hook arrived at opposite conclusion. • 1801, Sir William Herschel noted that high wheat prices occur when sunspots are few, and concluded that lower solar activity means less light and therefore less wheat…. • 1870s, 20 papers on rainfall: when sunspots are numerous, rainfall is more plentiful, and vice versa. • 1882, Balfour Stewart noted an 11-year cycle in Nile River flow. • 1889, D. E. Hutchins claimed an 11-year solar cycle in African droughts • 1987, Robert Currie examined drought records from China, North America and South America, and found 118 locations (61% of those examined) had 10-11 year cycles….
Climate response attributable to the sun’s variability: Not yet proven. • To establish Sun-Earth Climate Connection we need three scientific components: (1) accurate measurement of the change in the sun’s irradiance at the top of the Earth’s atmosphere (the so-called “solar constant”), (2) measurement of the atmosphere’s response (warming) attributable to (1) in the presence of larger noise, and (3) a theory connecting (1) and (2). • Until recently all three components were missing. Sun-weather connections were unproven conjectures. Many previous reports were no different from coincidences. • Starting 1979, satellites can now measure the variability in the “solar constant”, thus satisfying (1) on decadal time scales. • This talk concerns our work on (2) and (3).
ACRIM TSI composite by Willson and Mordvinov [2003] and an update of the PMOD TSI composite by Fröhlich and Lean [1998]. The black lines are the TSI averages in the periods 1980–1991 and 1991–2002.
Quantitative analysis: Total solar radiation varies by 0.1% from solar min to solar max, as detected by satellite at the top of the atmosphere. More at UV, uncertain at longer wavelengths. A variation of the solar “constant” S On 11-year time scale of about dS~0.90 watts m-2 . Ozone in the stratosphere absorbs 15%, 85% of the remaining gets to the troposphere. dQ=dS(0.85)/4 ~ 0.19 watts m-2. This 1/20 that due to a doubling of CO2, with dQ ~ 3.7 watts m-2. Equivalent to a 1% per year increase in greenhouse gases for 5-6 years from solar min to solar max.
Compare with Projections of Future Changes in Climate Projected warming in 21st century expected to be greatest over land and at most high northern latitudes and least over the Southern Ocean and parts of the North Atlantic Ocean
The reality of solar cycle response near surface is established. • Can we explain a near surface global warming of 0.2 K from 0.1% solar variation? • “Too large to be explainable” by direct radiative calculations; need an unknown amplifier. • Many strange theories….
Soon and Baliunas (2000):“Climate Hypersensitivity to Solar Forcing”: “The hypersensitive response of the climate system to solar UV forcing is caused by strongly coupled feedback involving vertical static stability, tropical thick cirrus ice clouds and stratospheric ozone” • No need for new mechanisms: same mechanisms as studied for decades in the global warming problem.
Radiative forcing from solar-min to solar-max: ~0.19 watts m-2. Periodic warming~0.2K. If real, can be used to calibrate climate sensitivity. Radiative forcing for double CO2: ~3.7 watts m-2 Equilibrium warming: Current range:1.5K – 4.5K, depending on model’sclimate sensitivity, which is uncertain. Solar cycle and Global Warming
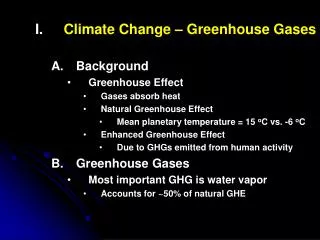
The Global Warming Controversy • There is no disagreement that the CO2 in the atmosphere is steadily increasing, and that it is a greenhouse gas. • The controversy lies instead in the magnitude of the predicted warming, which is model dependent: Is it 1.5 C? Or is it 4.5 C? The magnitude depends on how sensitive the climate is to radiative forcing. The factor of 3 uncertainty is caused by the positive feedback processes involving water in its various forms. Without water the warming is only 1.5 C at equilibrium at doubled CO2. • The solar cycle response can help determine the magnitude of earth’s climate sensitivity.
Human and Natural Drivers of Climate Change CO2, CH4 and N2O Concentrations - far exceed pre-industrial values - increased markedly since 1750 due to human activities Relatively little variation before the industrial era
Attribution of global warming to greenhouse gases uses models Observations • are observed changes consistent with • expected responses to forcings • inconsistent with alternative explanations All forcing Solar+volcanic
S=1367 Watts/m2 Sun’s radiation Total radiation intercepted by the circular disk =S times pR2 =total received by earth =Q * pR2/4. Q=S/4. Average radiation Received by earth =Q s(y), y=sinq
Time-dependent Held & Suares climate model with dynamical transport (annually averaged)
Perburbation Equationsmall perturbation, linear response Note that for small perturbations, different feedback (f’s) can be superimposed, i.e. f=Sfi. But gains (g’s) cannot.
Feedback processes • f1: water-vapor feedback: more water vapor in the upper troposphere more greenhouse effect. cloud feedback: more convection more clouds, traps more heat or reflects more to space. • f2: ice-snow albedo feedback: less ice/snow cover, lower albedo, earth absorbs more heat. • More feedback processes….
Global warming problemdifferent dQ, different t, possibly the same g. Common treatment of the problem: double CO2 run model to equilibrium, find equilibrium dT:
Implication for global warming predictions • Can be used to calibrate climate sensitivity related to water-vapor feedback. GCM’s will always have large uncertainty unless calibrated against observation. Model climate sensitivity: 1.5-4.5K; g~1-3. The range of uncertainty has not narrowed in over two decades. Which is right? ~3 K; g~2.