Download
1 / 18
180 likes | 274 Vues
RECENT RESULTS OF THE IGEC2 COLLABORATION SEARCH FOR GRAVITATIONAL WAVE BURST. Massimo Visco on behalf of the IGEC2 Collaboration. OUTLINE OF THE TALK. IGEC2 collaboration detectors IGEC2 activity during past years Data analysis methods Results of second data exchange of IGEC2: 2005-2007

E N D
RECENT RESULTS OF THE IGEC2 COLLABORATION SEARCH FOR GRAVITATIONAL WAVE BURST Massimo Visco on behalf of the IGEC2 Collaboration
OUTLINE OF THE TALK • IGEC2 collaboration detectors • IGEC2 activity during past years • Data analysis methods • Results of second data exchange of IGEC2: 2005-2007 • Data quality • Analysis parameters optimization • Results • Conclusion and perspectives of the IGEC2 observatory
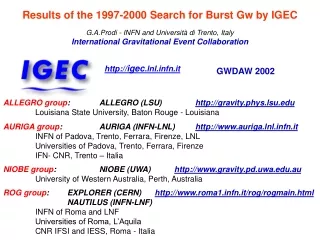
IGEC2 International Gravitational Events Collaboration ALLEGRO - AURIGA - ROG (EXPLORER-NAUTILUS)
SENSITIVITY OF IGEC DETECTORS • The best sensitivity is reached around 900 Hz
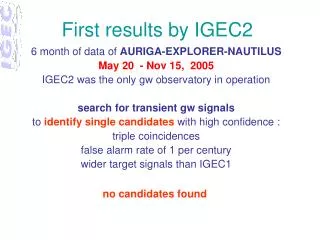
IGEC2 – searchforburstsignals 2005- … • First analysis- from May to November 2005 when no other observatory was operating. Based on three-fold coincidences. No detection • Second analysis – from November 16th, 2005 to April 14th, 2007 – Based on three and four-foldcoincidences. No detection • Future analysis - on April 14th 2007 ALLEGRO ceased data taking. Since then the three European detectors gathered new data yet to be analyzed.
DATA ANALYSIS METHODS • The analysis is based on time coincidence among candidate events selected in each detector. • The events selected by each group using filter matched to signals are characterized by Fourier amplitude H and arrival time ti: • h(t)= H · (t- ti) • The data are exchanged after adding a “secret time shift” to arrival time ti. • A statistical distribution of the accidental time coincidences number is calculated using lists of candidate events obtained from the original ones adding many different time shifts. • The analysis parameters (search threshold, coincidence window) are fixed “a priori” using the accidental coincidences analysis. • Finally the groups exchange the secret times and the search for real coincidences is performed.
IGEC 2 2ndperiod: Nov 16th, 2005 – Apr 14th, 2007 • The analysis is based on a composite search, an OR of five different configurations: four and three-fold coincidences. • To our knowledge this is the longest reported period of fourfold coincidence observation. • The background was fixed at 1 event/century equally divided in the four configurations (0.2 event/century each). • The data of 2007 became available later, they were analyzed using slightly different SNR thresholds.
OPERATION TIME – NOV 16th 2005–APR 14th, 2007 515 days Full coverage 94% of time useful for analysis 57% of time with 4 detectors
EVENTS AMPLITUDE DISTRIBUTIONS • SNR > 4.5 for AURIGA • SNR > 4.0 for EXPLORER and NAUTILUS • H > 1.1· 10-21 Hz-1 for ALLEGRO
Few events/day with SNR>7 Few very large events (SNR>30) on the whole period DATA QUALITY: DISTRIBUTIONS OF EVENTS
TUNING OF ANALYSIS PARAMETER The R factor must be maximized. It depends on shape and energy of the different signals • Analysis target are: • a false alarm low enough to select significantcandidate events (1 event /century) • areasonable detection efficiency for the searched signals (to be evaluated by software injections) • The parameters to be tuned are: • events SNRselectionthreshold • time coincidence windows
TIME UNCERTAINTY • The time windows were chosen large enough to include not only -like signals. • By software injection we tested the response also to damped sinusoids: • h(t)=h0 sin(2 f0 t) e-t/ (t) • Statistical uncertainty: 95% of coincidences retrieved with a 25 ms windows • Systematic biases: the time bias is within 15 ms for <30 ms
TIME COINCIDENCE WINDOW • The maximum light travel time between detectors is: • 2 ms for European detectors • 20 ms European - United States detectors • The chosen time windows were: • 40 ms for European detectors coincidences • 60 ms for European - United States detectors coincidences
SNR SELECTION • Once the time windows were fixed, we tuned the SNR thresholds to the required false alarm. • We used different thresholds for each configuration and for each detector: equal for ALLEGRO, EXPLORER, NAUTILUS and higher by a factor 1.5-1.8 for AURIGA Example of threefold coincidence EX-NA-AU Selected threshold configuration to have 0.2 event/century
BACKGROUND EVALUATION • In order to highlight possible data correlation the background analysis was implemented using more than one time shift. • We used 13 different time shifts from 0.12s to 3s. • For each shift value we performed about 12 million of time lags. Averaged false alarms with their standard deviations The experimental false alarm error is larger than the statistical one But this does not effect our analysis
BACKGROUND EVALUATION • A precise evaluation of errors, including systematic effects, was made possible by calculating false alarms with different time shifts. • Each first row contains experimental occurrence probability from time shifts • Each second row contains Poisson probability using the experimental mean • The two values are fully compatible
FINAL RESULTS NO COINCIDENCE given a false alarm of 1/century • The collaboration established a priori to make available the coincidences found with no selection, at high false alarm, for further analysis with other experiments.
CONCLUSION • Nowadays interferometric detectors have reached a sensitivity at least one order of magnitude better than bar detectors and no further upgrade is scheduled. • The IGEC observatory is presently capable of unattended, low cost operations with high duty cycle and low false alarm. • Interferometric detectors have scheduled up-grades in the near future and an important increase in sensitivity is expected. • At present the role of bar detectors is to guarantee the coverage for rare but powerful events with specific attention to the periods not covered by interferometers.