Download
1 / 14
140 likes | 326 Vues
Schenectady Energy Advisory Board Recommendations Carbon Emissions Analysis briefing July 21, 2008 Dana Swalla, Ph.D. Acknowledgements. Union College Faculty/students:. Frank Maurizio Stephen Boese Mark DeChiro – Vice Chair Jeff Edwards Jeff Corbin Dana Swalla - Chair Andy Shapiro.

E N D
Schenectady Energy Advisory Board Recommendations Carbon Emissions Analysis briefing July 21, 2008 Dana Swalla, Ph.D.
Acknowledgements • Union College Faculty/students: Frank Maurizio Stephen Boese Mark DeChiro – Vice Chair Jeff Edwards Jeff Corbin Dana Swalla - Chair Andy Shapiro Jeff Corbin – Faculty Sarah Conner Robert Eastman Steve PoChedley • Energy Advisory Board Members: • National Grid: • Administration Staff: Pat Boudreau Sharon Jordan Ismat Alam Carl Olsen Bernie Sisson John Collucio
Outline • Background • City Municipal Operations • Water • Vehicle Fleet • Buildings and other operations • City of Schenectady buildings data (National Grid) vs. Municipal Operations • Conclusions and Future Work
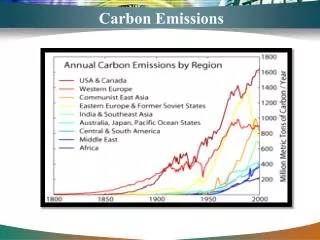
Background • Industrial processes, burning of fossil fuels, and changes in land use releases gases into the atmosphere that create a “greenhouse” effect at a rate much faster than “natural” processes • Recent increases in global average temperature are much higher than “normal” fluctuations. • …and excess energy use costs $$ Industrial Revolution begins See References at end of presentation
Background • Carbon Emissions are reported in units of metric tonnes of carbon dioxide (CO2e). This unit allows comparison between emissions of different greenhouse gases of varying global warming potential to be added together. • Example: 10 kwh * 0.86 lbs CO2e/kwh = 8.6 lbs CO2e 10 therms * 12.32 lbsCO2e/therm = 123.2 CO2e 1 metric tonne = 1.1025 short tons = 2205 lbs 1.1 * 440 * • Recommendations were developed after completing a Carbon Emissions analysis for all City Municipal operations and City residential, commercial, and industrial buildings.
Background How much is used (gas, CO2, $$ on 100 mile trip?? 10 mpg 15 mpg vehicle saves 3 gals gas and $15 every 100 miles driven 25 mpg 35 mpg vehicle saves about 1 gal gas and $5 every 100 miles driven.
City Municipal Operations • Municipal Operations Recommendations: • General: • Initiate and maintain procedures that allow convenient tracking and analysis of carbon emissions across all sectors. • Buildings Sector • City owned buildings undergoing major renovations or new construction must meet LEED or equivalent standards. • Complete Siemens performance contract building upgrades and continue to document energy savings. • Encourage energy service providers to submit all billing electronically to allow for easier energy usage tracking (i.e. carbon footprint analysis), as well as reduce paper waste and costs associated with paper billing storage. • Work with Union College to calculate and track emissions from buildings annually using electronic data. • Water • Develop a strategy to conserve water in order to save energy, control infrastructure costs and preserve flexibility for future water supplies and needs. 3122 tonnes 2725 tonnes 2315 tonnes Combined City Municipal Operations Emissions from all sources = 9283 tonnes * 10,000 * 4 Million
Vehicle Fleet • Vehicle Fleet Sector • Initiate vehicle purchase policy for all city departments that encourages use of higher gas mileage/lower emissions vehicles • Install devices to lower particulates on selected vehicles • Encourage vehicle sharing between departments, when feasible • Calculate and track emissions from vehicle fleet annually.
Recommendations (City Municipal Operations) • Street lights and Traffic Signals Sector • Work with National Grid to encourage development of more energy efficient street lights. • Complete work on LED Traffic light replacement and work with National Grid, Siemens, and city departments to fully capture energy savings that have resulted from traffic light replacement. • Transportation Recommendation • New road development projects will make provisions for bicycle and pedestrian traffic, including the new Erie Boulevard corridor project. • Planning commission should encourage installation of bike racks in all new developments and major renovation projects • Install bike racks in areas of commerce and recreation. • Work with Union College students to formulate a traffic usage summary to estimate carbon footprint of vehicle traffic in Schenectady. Note: Solid waste/trash collection and recycling not considered in this study… However, City saved about $60-$85K in tipping fees, alone (not counting cost of transport to landfill) and reduced collection by 3% or 1000 tons after initiation of garbage “equity” (aka garbage “fees” depending on # of units)
City Municipal Operations 7% reduction @ 11¢/kwh = approx $98,000 in savings (electric) 29 Kwh (electricity) = Heating value of 1 Therm 29 kwh * 0.86 lbs CO2/kwh = 25 lbs CO2 1 Therm * 12.32 lbs CO2/therm = 12.32 lbs CO2 ….Heating a building with Natural Gas is currently more efficient and results in less CO2 than heating with electric. However, this may change as grid electric moves to more renewable energy sources…
Results of Siemens Performance Contract Net decrease from 2005: 170 metric tons % decrease from 2005 4% Target by 2012: Net 7% Note: Analyses only for municipal operations & bldgs measured by Siemens
City of Schenectady Building Emissions vs Municipal Operations Emissions from non-municipal sources >>> than City operations …. About 6 tons per capita just for heating and cooling homes and businesses! 377,000 tonnes • Community outreach recommendations • Work with the Energy Advisory Board to develop the following: • ·Annual Energy Fair hosting local “green” businesses and teaching best practices. • ·Collaboration with local grade schools (ie school forum, science fairs, information booklets to bring home) • ·Neighborhood Association presentations • ·Development of residential “Eco-Teams” similar to Burlington, VT • Set up EAB website available through a link from the main City website to track progress and inform the public of ongoing initiatives, meetings, and minutes
Conclusions & Future Work • Siemens Performance Contract has resulted in improved energy savings. • We have more work to do to reach goal of 7% reduction in emissions by 2012. • Major focus areas • Water pumping costs and conservation. • Develop a strategy to conserve water in order to save energy, control infrastructure costs and preserve flexibility for future water supplies and needs. • City Vehicle Fleet • Improve mileage or limit use of lowest mileage cars/vehicles whenever possible
References Carbon emissions calculation and emissions factors http://www.epa.gov/climatechange/emissions/ind_calculator.html Inventory of New York City Greenhouse Gas Emissions, April 2007 • Global Average Temperature plot • http://www.globalwarmingart.com/ • (dark blue 1000-1991):P.D. Jones, K.R. Briffa, T.P. Barnett, and S.F.B. Tett (1998). , The Holocene, 8: 455-471. • (blue 1000-1980):M.E. Mann, R.S. Bradley, and M.K. Hughes (1999). , Geophysical Research Letters, 26(6: 759-762. • (light blue 1000-1965):Crowley and Lowery (2000). , Ambio, 29: 51-54. Modified as published in Crowley (2000). , Science, 289: 270-277. • (lightest blue 1402-1960):K.R. Briffa, T.J. Osborn, F.H. Schweingruber, I.C. Harris, P.D. Jones, S.G. Shiyatov, S.G. and E.A. Vaganov (2001). , J. Geophys. Res., 106: 2929-2941. • (light green 831-1992):J. Esper, E.R. Cook, and F.H. Schweingruber (2002). , Science, 295(5563: 2250-2253. • (yellow 200-1980):M.E. Mann and P.D. Jones (2003). , Geophysical Research Letters, 30(15: 1820.DOI:10.1029/2003GL017814. • (orange 200-1995):P.D. Jones and M.E. Mann (2004). , Reviews of Geophysics, 42: RG2002.DOI:10.1029/2003RG000143 • (red-orange 1500-1980):S. Huang (2004). , Geophys. Res Lett., 31: L13205.DOI:10.1029/2004GL019781 • (red 1-1979):A. Moberg, D.M. Sonechkin, K. Holmgren, N.M. Datsenko and W. Karlén (2005). , Nature, 443: 613-617.DOI:10.1038/nature03265 • (dark red 1600-1990):J.H. Oerlemans (2005). , Science, 308: 675-677.DOI:10.1126/science.1107046 • (black 1856-2004): Instrumental data was jointly compiled by the w:Climatic Research Unit and the UK Meteorological OfficeHadley Centre. Global Annual Average data set TaveGL2v [2] was used. • Documentation for the most recent update of the CRU/Hadley instrumental data set appears in: P.D. Jones and A. Moberg (2003). , Journal of Climate, 16: 206-223.