The FluRedox Principle: Single Enzyme Sensing with Advanced Biosensors
This paper explores the FluRedox principle for biosensing single enzymes. Key advancements include novel methods for fluorescence detection and electrochemical control, facilitating the measurement of redox states in enzymes like β-D-Galactosidase and Nitrite Reductase. The study employs Förster Resonant Energy Transfer (FRET) alongside cyclic voltammetry for enhanced resolution of enzyme activity, demonstrating significant insights into single-molecule behavior and enzyme kinetics. Results reveal novel interaction dynamics and offer a framework for future biosensor development.

The FluRedox Principle: Single Enzyme Sensing with Advanced Biosensors
E N D
Presentation Transcript
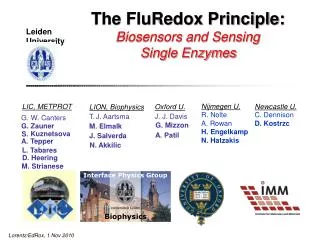
LIC, METPROT Oxford U. LION, Biophysics G. W. Canters J. J. Davis T. J. Aartsma G. Zauner G. Mizzon M. Elmalk Kuznetsova A. Tepper A. Patil J. Salverda L. Tabares N. Akkilic D. Heering M. Strianese The FluRedox Principle: Biosensors and Sensing Single Enzymes Leiden University Nijmegen U. Newcastle U. R. Nolte A. Rowan H. Engelkamp N. Hatzakis C. Dennison D. Kostrzc S. Interface Physics Group Biophysics Padua 15 April 2010 Lorentz/EdRox, 1 Nov 2010
Förster Resonant Energy Transfer FRET Lorentz/EdRox, 1 Nov 2010
Fluorescence detection of redox state No FRET FRET Energy +e- -e- Reduced Oxidized Lorentz/EdRox, 1 Nov 2010
+ ++ Proof of principle Now for: Lorentz/EdRox, 1 Nov 2010 Anal. Biochem. 350 (2006) 52
Single Molecules Lorentz/EdRox, 1 Nov 2010
Proc. Natl. Acad. Sci. (1961), 47. 1981 Lorentz/EdRox, 1 Nov 2010
The first single enzyme experiment (1961) Oil β-D-Galactosidase + H2O Oil B. Rotman, P.N.A.S. 1961, 47, 1981. Lorentz/EdRox, 1 Nov 2010
Cholesterol oxidase E FADH E FAD . . 2 Fluorescent H2O2 O2 Cox in oxidized form H. P. Lu, L. Xun, X. S. Xie, Science, 1998, 282, 1877. Lorentz/EdRox, 1 Nov 2010
FRET & Electrochemistry: Fluorescent CV The quest for single molecules Lorentz/EdRox, 1 Nov 2010
Potentiostat CCD camera Fluorescence detection with Potentiostatic control Counter electrode Reference electrode Protein with attached dye Work electrode Gold with C8 monolayer and wt-azurin Fluorescence microscope Lorentz/EdRox, 1 Nov 2010
Fluorescence image (32x32 μm) of WT azurin Cyclic Voltammetry 200 mV/s Lorentz/EdRox, 1 Nov 2010
16 μm 37 μm Results – fluorescence switching Widefield (Leiden): near-monolayer w. variable brightness TIRF (Oxford): very low coverage in clusters Fluorescence traces show cyclic redox switching Lorentz/EdRox, 1 Nov 2010
150 100 Potential (mV, vs. SCE) 50 0 -50 0.1 1 10 100 0.01 -100 Scan rate (V/s) Scan rate dependence FCV and CV: increase of separation to ~40 mV at 1V/s (widefield (Leiden) data example, FCVs from full images) 10 mV/s 100 mV/s 1 V/s Lorentz/EdRox, 1 Nov 2010
50 40 30 20 10 Thermodynamic (E0) dispersion Widefield (wt azurin) (Leiden) TIRF (N42C) (Oxford) Frequency 0 10 30 50 70 -30 -10 -50 E vs. SCE (mV) 0 E0 dispersion much larger in more dilute TIRF sample! Lorentz/EdRox, 1 Nov 2010
Kinetic (k0) dispersion Widefield (wt azurin) (Leiden) TIRF (N42C) (Oxford) 20 15 Frequency 10 5 0 * Large k0 dispersion in both datasets! * Factor 100 difference within 10 micron on surface possible Angew. Chemie 2010, in press Lorentz/EdRox, 1 Nov 2010
Dispersion E0 • Protein-protein complexes • Effect of charges • Dielectric between partners • Protein-surface interaction • El. Fields of 3-30mV/Å ΔE0: 0-100 mV Batie & Kamin, JBC 256(1981)7756 Knaff cs BBA 635(1981)405 Davidson cs JBC 263(1988)13987 Haehnel cs Biochem 35(1996)1282 Murgida & Hildebrandt Chem S Rev 37(2008)937 Lorentz/EdRox, 1 Nov 2010
k0 n Dispersion k0 Feng et al. J.Chem.Soc. Far. Trans. 1997 93, 1367 Lorentz/EdRox, 1 Nov 2010
Nitrite Reductase NiR Lorentz/EdRox, 1 Nov 2010
Cu-containingNitrite Reductase - NiR NO e- NO2- Xred e- Xox Lorentz/EdRox, 1 Nov 2010
What will happen during turnover? Ex Ex Ex Em Em Em e- NO NO2- Lorentz/EdRox, 1 Nov 2010
Nitrite Reductase NO2- + e- + 2H+ NO + H2O J. Biol. Chem. 281 (2006) 16340 Lorentz/EdRox, 1 Nov 2010
Confocal Fluorescence Spectroscopy of NiR Lorentz/EdRox, 1 Nov 2010
Experimental set-up Sampleplane Objective Point laser light source Detection pinhole Single photon detector Lorentz/EdRox, 1 Nov 2010 PNAS(2008) 105, 3250.
Measuring single molecules at work Inactive and bleaches Background Turning over and bleaches Turnover! Lorentz/EdRox, 1 Nov 2010
Intensity histogram 25 20 Poissonian distributions 15 Counts / 10 ms 10 5 0 360 361 362 Time, s 700 25 Binsize: 10 ms 600 20 500 15 400 Counts / 10 ms Number of bins 300 10 200 5 100 0 0 300 320 340 360 380 400 Time, s 0 5 10 15 20 25 counts/bin Lorentz/EdRox, 1 Nov 2010
NiR - ATTO 655 turnovers with asc/PES 25 20 15 Counts / 10 ms 10 5 low bg 0 300 320 340 360 380 400 Time, s 25 20 15 Counts / 10 ms 10 high 5 low bg 0 362 361 360 Time, s 20mM HEPES pH7 10mM NO2- 3mM ascorbate 0.3 nM PES high 7000 6000 5000 4000 Number of events 3000 2000 1000 0 0 5 10 15 20 25 Fluorescence intensity, counts/10 ms Lorentz/EdRox, 1 Nov 2010
Fluorescence time trace: AUTOCORRELATION Fluorescence t1 t2 Autocorrelation: Correlation of a signal with its time-shifted image. t Lorentz/EdRox, 1 Nov 2010
S3 k3 k2 k-3 k-2 S2 S1 k-1 k1 RO k3 k2 k-3 e OO OR k1 NO NO2- λ1, λ2: f (ki) Qian & Elson Biophys Chem 101-102 (2002) 565 Lorentz/EdRox, 1 Nov 2010
[NO2-]-dependent autocorrelation decay timing X b=0.8 The autocorrelation curves can be fitted to a stretched exponential: 0.7 0.6 to,ms 70 34 22 17 0.6 Lorentz/EdRox, 1 Nov 2010
Single exponential means Single rate: Stretched exponential means Distribution of rates: ρ 0.8 0.7 τ/τ0 Mumbai 4 Nov 2009
Why a "stretched" instead of a simple exponential? [NO2-] 5mM 50mM 500mM 5000mM b 0.81 0.72 0.60 0.61 0.070 s 0.034 s 0.022 s 0.017 s • In the stretched exponential t is not a single value but a distribution • The distribution of t depends on b :if b=1, there is no distribution in t if b<1, the distribution becomes broader b = 0.6 1 order of magnitude distribution WHY? Mumbai 4 Nov 2009
A partial disorder at the catalytic heart of NiR First coordination sphere - Type-1 Cu site: Met150 is partially disordered - Type-2 Cu site: The water ligand is disordered in the reduced state Proton delivery - His255: is partially disordered - Asp98 : has a large B-factor - Network of water molecules PNAS 105 (2008) 3250 Lorentz/EdRox, 1 Nov 2010
How can we get the kinetics parameters? Global fit: 1/ t [s-1] Mumbai 4 Nov 2009
How can we get the kinetics parameters? Electron Transfer Rate between Cu1 and Cu2! k2 ( k3 + k-3 ) = 31 mM KM = k1 ( k2 + k3 ) In good agreement with in-bulk measurements : 50 mM and 8.0 s-1 k2k3 Vmax = = 6.5 s-1 ( k2 + k3 ) k1 = 3.5 x10⁵ M-1s-1 k2 = 9.5 s-1 k3 = 21 s-1 k-3 = 14 s-1 Mumbai 4 Nov 2009