Download
1 / 34
340 likes | 476 Vues
Measuring Development and Closing Gaps: the relevance of global stats in a climate constrained World. Mariama Williams South Centre Beyond GDP and Global Statistics : How to measure Development in the context of the post 2015 development agenda framework . Outline.

E N D
Measuring Development and Closing Gaps:the relevance of global stats in a climate constrained World Mariama Williams South Centre Beyond GDP and Global Statistics : How to measure Development in the context of the post 2015 development agenda framework
Outline • Development and development gaps • GDP challenges and constraints for closing development gaps • The shift – alternative measures do they get us closer to the closing gaps and resolving challenges? • The shift – taking on board unpaid work & time poverty • The Shift – accounting for planetary limits: Vulnerability-Resilience & EAF
Development • Growth v well being ? Growth and well being? • Quest for human development gender equality and happiness • A sustainable ‘collaspe- free future • Quality of life • Ending poverty and deprivation • Access to modern energy services • Food security • Time prosperity
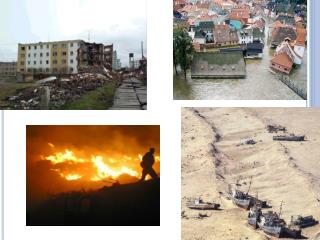
Development and related Gaps Productivity gap (need innovation & access to technology) • Income gap, Infrastructure gap • Health, water and sanitation gaps • Adaptation, resilience and L&D • Unsustainable debt overhang • Gender gaps • Mitigation gap**
What we need to measure and assess the principal drivers of development: • Growth (‘green’ and environmentally sustainable etc.) ‘growth as usual is not an option • Employment (decent & living wages) • Distribution (equitable) • Technology & Innovation Now in the context of sustainable development (low carbon pathways and the constraints of adaptation and vulnerability to extreme weather)
What we need to measure and assess • Human well being (not the same as economic growth) • Progress in ensuring sustainable development social goals: food, shelter, freedom, participation (not just volume of marketed economic activity Economic goals: production finance Environmental goals: carrying capacity of ecosystem, reducing GHGs in atmosphere; preventing dangerous climate change
Traditional System GDP Estimate of market throughput (produced in the economy): sum of final goods and services produced and traded for money within a given time: Y=C+I+G+Xn and net capital formation Include some non market production: defense spending Excludes: volunteer work, depletion of natural resources and unpaid work GNP Measure all production by domestic companies regardless of where in the world they produce.
GDP & System of National Accounts GDP is a measure of economic activity, not economic well being Misused to measure economic well being Kuznets cautioned against equating GDP growth with economic or social wellbeing: Main aim: how fast economy is growing? What is the pattern of spending on goods and services? How much income goes for consumption, Investment or savings?
GDP - Biases and Challenges • Underlying emphasis is growth; aim to speed up economic progress • A specialized tool useful in a particular historical conjuncture (post WWII ; no an indicator for well being. • Problem is it has become the ‘sin qua non for economic progress: see per capita GDP used for comparing quality of life between countries. • Used by governments as indicator of success of economic and fiscal policies
GDP challenges and constraints • Over focus on ratcheting up GDP growth It measures everything… except that which makes life worthwhile… Robert F. Kennedy, 1968 Kuznets feared that the simplicity of GDP, which only measure a narrow segment of society’s activity, makes it prone to mis-use GDP Gives incomplete picture of the system of the human economy Missing the social and environmental systems
GDP Challenges and constraints • Encourages activities that are counter to long term community well being (Costanza et al 2009) • Encourages depletion of natural resources faster than they can renew themselves, degrades eco systems • (1997 the world’s ecosystem is estimated to provided benefits valued at average $33 trillion per year.)
Herman Daly: the current national accounting system treats the earth as a business in liquidation (Cobb, Halstead et al 1995)
GDP challenges and constraints • Threshold effect: as GDP increases, overall quality of life often increases up to a point, beyond this increases in GDP are offset by the costs (increasing income inequality, loss of leisure time, natural capital depletion (Costanza eta al 2009)… lowers community cohesion, healthy relationships, knowledge, wisdom, a sense of purpose, connection with nature and other dimensions of human happiness. Costanza et al. (See also Deep Economy. Mc Kibbon 2007)
Alternatives to GDP—the corrective approach GDP and SNA are foundational. Modify by adding and subtracting: • Index of sustainable economic welfare • Genuine Progress Indicators • Green GDPs/Genuine Wealth Limitations: treatment of non monetary term such as volunteer labour—no consensus Subjectivity with regard to beneficial expenses and detrimental expenses to be subtracted How to quantify the costs of depleting natural resources—no consensus
Index of sustainable economic welfare/GPI • ISEWGPI, 1989 Daly and Cobb. For the Common Good • Based on Index of Economic Aspects of welfare(Zolotas) and Measure of economic wealth ( Nordhaus and Tobin). • Aim: account for both current and environmental issues and long term sustainable use of natural ecosystem and resources
Green GDP • Factoring environmental degradation and depletion of natural resources into national accounts (Developed for Japan, Australia, Canada, china, costa Rica, Indonesia, Mexico, PNG, and the US. But no regular reporting. China is focused on doing so
Genuine Savings • WB 1977: the true level of saving in a country after depreciation of produced capital; investments in human capital (education expenditures); depletion of minerals, energy, and forests; and damage from local and global air pollution. Including carbon emissions. • Measure built, natural and intangible capital • Calculated for 120 countries • See WB 2006 Where is the wealth of nations • Increasing economic activity by selling off natural resources results in lower welfare in the long run.
Non GDP based indexes Focus on measuring environmental or social activities, well being or changes in environmental, social or human capital • Ecological foot print: humanity’s foot print is 23-40% larger than the renewable rates • Subjective well-being (SWB) • Gross national happiness (Bhutan) 1980s– a principle not an index initially but since 2004 more sophisticated work done on it via the Gross National Happiness Commissioned
Other Competitive Index • HDI 1990 UNDP focus on longevity, knowledge and decent living standards as proxy for people’s ability to live long and prosperous lives • Living Planet report.WWF: measure of world’s forest, freshwater and marine ecosystem. Track biodiversity. Human use of earth bio capacity is exceeding the regenerative capacity by 25%(2006 report)
Other indexes continue • Happy Planet Index. New Economics Foundation Measure country’s ecological efficiency in delivering human well being. Composite of LE, Life satisfaction, ecological foot print.
Non aggregated indictors(indicator suites) • National income satellite accounts (also use physical units as well as monetary units): 1)flow accounts 2)expenditure accounts 3) nat. resource asset accounts a4) non market flow and environmentally adjusted aggregates • Calvert-Henderson Quality of life Indicators: education, economy, energy, environment, health, human rights, income, infrastructure, national security, public safety , recreation and shelter. • MDGs
Barriers to measuring real progress • Data/methodology issues • Social/institutional issues Data issues: reliability, availability, timeliness and appropriate scale (level of detail of the data collected and reported) and scope (breadth of the items that are measured). Methodology Barriers: standardization and embedded values issues Social and institutional barriers: resistance to change. Dominance of growth is good paradigm, lack of leadership and the power of vested interest groups to maintain the status quo.
The shift.Alternatives to measuring progress • GDP measures economic quantity • Encourages Depletion environmental and social capital Should GDP be improved, supplemented or replaced? • Measure of quality of welfare • Protecting social and environmental capital • 1) correctives to GDP • 2)direct measures of well being
Summing up • National indicators are ‘dashboard or compass that signals whether national level polices and programmes are moving in the right direction • What you measure you value and what you value you measure. • GDP - a useful sign post, but beyond its sell by date? • Time for new consensus
Bottom initiatives • Solidarity or social economy • Happiness movement • De-growth (academic dis of how to restructure economies in ways that are not dependent on growth) • downshifting movement (work and earn less for more time and higher qualitiyof life.
The end of the growth paradigm • The rise of happiness
Examples of Vulnerability Index Developments • CDP’s • Eight indicators, grouped into an exposure index and a shock index
SIDS-specific Existing Initiatives/Activities • Vulnerability-Resilience Assessment Framework • (SIDS Unit/DESA) Source: Nizar Mohamed Technical Report (2010)
SIDS-specific Existing Initiatives/Activities • Vulnerability-Resilience Assessment Framework • (SIDS Unit/DESA) Source: Nizar Mohamed Technical Report (2010)
Existing Initiatives/Activities by International Organizations Wealth Accounting and the Valuation of Ecosystem Services (WAVES) (World Bank) • Support countries move to Natural Capital Accounting • Aims to promote sustainable development by ensuring that the national accounts used to measure and plan for economic growth include the value of natural resources. http://www.wavespartnership.org/waves/
The System for Environmental-Economic Accounts (SEEA) The System of Environmental-Economic Accounting (SEEA) provides the framework for transforming sectoral data into integrated policy-relevant information. Sectoral Data Integrated information Integrated information provides a comprehensive picture to support policy making. UN Statistics
references • Beyond GDP: the Need for New Measures of Progress. R. Costanza, M. Hart, S Posner and J. Talberth 2009. the Pardee Papers no.4. Jan 2009. • Life Beyond Growth. 2012 Report of the Institute for Studies in Happiness, Economy and Society • It about “TIME”: Why time Deficits Matter for Poverty. Antonopoulos, R., Masterson, T., and A. Zacharias Levy Economics Inst. 2012
KenetiFaulalo, 2013 From Barbados to Samoa: Measuring Progress beyond GDP in the context of small island developing States (SIDS) EGM on SIDS and post-2015 Agenda 24th April 2013, UNHQ, NY