Download
1 / 38
380 likes | 539 Vues
State of the Region. UALR REGIONAL STEWARDSHIP CONFERENCE SEPTEMBER 14, 2004. A COUNCIL OF LOCAL GOVERNMENTS. FOUNDED IN 1955 to conduct long-range public infrastructure planning to support the growth of the central Arkansas metropolitan area

E N D
State of the Region UALR REGIONAL STEWARDSHIP CONFERENCE SEPTEMBER 14, 2004
A COUNCIL OF LOCAL GOVERNMENTS FOUNDED IN 1955 to conduct long-range public infrastructure planning to support the growth of the central Arkansas metropolitan area MEMBERS = 5 Counties and 23 Cities in Central Arkansas METROPOLITAN PLANNING ORGANIZATION METROTRENDS - Economic and Demographic Review and Outlook To Subscribe: Metroplan 501 West Markham Little Rock, Arkansas 72201 metroplan.org CURRENT MAJOR ACTIVITIES: METRO 2030 Long-Range Transportation Plan Update Central Arkansas Clean Air Task Force Mid-Arkansas Water Alliance
WHAT WE’LL TALK ABOUT • Why regions are important • Varying definitions of “regions” used in central Arkansas • Some facts about our region, and others
1950’s Economic Competition • Shreveport and New Orleans, LA • Jackson, MS • Dallas and Ft. Worth, TX • Tulsa, OK • Springfield and St. Louis, MO • Memphis, TN
Dallas-Ft. Worth Houston New Orleans Jackson Fayetteville St. Louis Kansas City Chicago Philadelphia Charlotte New York Seattle Portland Los Angeles Toronto Tokyo Taipei Hong Kong New Delhi Calcutta Capetown Cairo Rome Brussels Madrid Manchester Dublin Etc. etc. 21st CENTURY COMPETITION
In a Global Economy Our metropolitan area is in competition with every other metro economy on earth for talent, capital and natural resources. The more educated and skilled our workforce, the higher our quality of life, the better our public infrastructure supports our activities at a reasonable tax rate, the more competitive we will be in the world of the future.
WHAT REGION ARE WE TALKING ABOUT? IT DEPENDS ON WHAT SUBJECT WE ARE TALKING ABOUT IN no country in the world has the principle of association been more successfully used or applied to a greater multitude of objects than in America. As soon as several of the inhabitants of the United States have taken up an opinion…which they wish to promote in the world, … they combine. From that moment they are no longer isolated men, but a power seen from afar, whose actions serve for an example and whose language is listened to. Alexis de Tocqueville, Democracy in America
Harrison Fayetteville Jonesboro Fort Smith Russellville Little Rock Hot Springs Pine Bluff El Dorado Basic Trading Areas WithinLittle Rock Major Market Area
• West Plaines, MO • Mt. Home • Harrison • Fayetteville • Jonesboro • Batesville • Blytheville Heber Springs • Fort Smith • Russellville • • West Memphis • Searcy Little Rock • Stuttgart • • Hot Springs Pine Bluff • • Idabel, OK • Texarkana • Magnolia • Crossett • El Dorado Arkansas Commuting Sheds
TRANSPORTATIONCentral Arkansas Regional Transportation Study
1980-2000 LR-NLR MSA Faulkner Pulaski Lonoke Population 583,845 2000 Census 21.8 percent of state Land Area 3,005 square miles 5.6 percent of state Total Personal $17.0 billion Income 2001 28.7 percent of state Per Capita Personal $28,845 Income 2001 Saline
2000 LR-NLR-MSA Faulkner Perry Pulaski Lonoke Population 610,518 2000 Census 22.8 percent of state Land Area 4,198 square miles 7.9 percent of state Total Personal $17.6 billion Income 2001 28.7 percent of state Per Capita Personal $28,457 Income 2001 Saline Grant
LR-NLR-Pine Bluff-Searcy Combined Statistical Area White Faulkner Perry Pulaski Lonoke Population 785,024 2000 Census 29.4 percent of state Land Area 7,325 square miles 13.8 percent of state Total Personal $20.97 billion Income 2001 34.2 percent of state Per Capita Personal $26,447 Income 2001 Saline Grant Jefferson Lincoln Cleveland
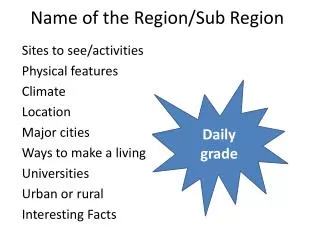
WHAT TO MEASURE ABOUT THE REGION? • Focused on Regional Goals • Economy • Education • Environment • Transportation • Community • Land Use/Housing • Goals For Central Arkansas -- 1974
WHAT TO MEASURE ABOUT A REGION • Some Measure Against Oneself Over Time to Gauge Progress • Some Measure Against Competing Regions
Average Annual Percent PopulationGrowth Percent Growth
URBAN FORM Little Rock - North Little Rock Metro Area 18th Most Sprawling Metro Area
Component Score Rank Components Rankings for LR/NLR MSA Housing Density 77.5 7 Mix of Housing, Jobs, Services 68.27 10 Street Connectedness 88.17 30 Strength of Centers 105.86 49
Metro Area Rating Overall Sprawl Rankings 1. Riverside/San Bernardino, CA 14.2 2. Greensboro/Winston-Salem NC 46.8 3. Raleigh/Durham NC 54.8 4. Atlanta, GA MSA 57.7 5. Greenville/Spartanburg, SC MSA 58.6 6. W. Palm Beach/Boca Raton FL, MSA 67.7 7. Bridgeport/Stamford CT NECMA 68.4 8. Knoxville, TN MSA 68.7 9. Oxnard/* CA MSA 77.2 10. Ft. Worth, TX PMSA 77.2 18. LR/NLR AR MSA 82.2 83. NYC, NY PMSA 177.8
Metro Area Rating Regional Comparisons 10. Ft. Worth, TX PMSA 77.23 13. Dallas, TX PMSA 78.26 18. LR/NLR, AR 82.27 21. Oklahoma City, OK MSA 85.58 23. Birmingham, AL MSA 87.97 24. Baton Rouge, LA MSA 90.13 31. Memphis, TN-AR-MS MSA 92.15 32. Houston, TX PMSA 93.30 35. St. Louis, MO-IL MSA 94.51 43. Tulsa, OK MSA 99.06 59. Austin, TX MSA 100.26 74. New Orleans, LA MSA 125.39 76. Portland, OR MSA 126.12
Mean Travel Time Change in Percent 1990 2000 Minutes Change USA 22.4 25.5 3.1 13.8 LR-NLR MSA 19.9 22.9 3.0 15.1 Faulkner Co. 21.8 24.8 3.0 13.8 Lonoke Co. 23.5 27.5 4.0 17.0 Pulaski Co. 18.4 20.8 2.4 13.0 Saline Co. 24.2 27.0 2.8 11.6
1990-2002 UnemploymentLR-NLR vs Arkansas and National Averages
Percent of Population In Poverty Percent
K-12 Public School Enrollmentas Percent of Total Enrollment 1970-2000 Percent Enrollment
Education Attainment in SelectedSouth Central Metros Percent
2000 Cost of Living Index for Selected South Central Metro Areas
“Even if you’re on the right track, you’ll get run over if you’re standing still” --Will Rogers