Download
1 / 36
360 likes | 492 Vues
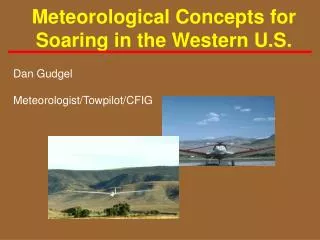
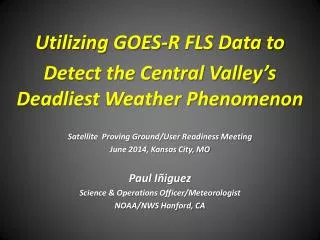
Utilizing GOES-R FLS Data to Detect the Central Valley’s Deadliest Weather Phenomenon Satellite Proving G r ound/User Readiness Meeting June 2014, Kansas City, MO Paul Iñiguez Science & Operations Officer/Meteorologist NOAA/NWS Hanford, CA. What’s the problem?.

E N D
Utilizing GOES-R FLS Data to Detect the Central Valley’s Deadliest Weather Phenomenon Satellite Proving Ground/User Readiness Meeting June 2014, Kansas City, MO Paul Iñiguez Science & Operations Officer/Meteorologist NOAA/NWS Hanford, CA
What’s the problem? Example of tule fog at the NOAA/NWS Hanford, CA office on 26 Nov 2012. The KHNX radome is roughly 400 ft/120 m away in this image. View of fog on visible satellite, approximately the same time as the bottom picture.
Fog in Central California Based on 10 years of ASOS data.
Fog in Central California LIFR <1SM VLIFR <1/2SM
What’s the problem? Elevation (m) ASOS/AWOS
What’s the problem? Where are the high impact areas?
What’s the problem? Location of Fatal Fog-Related Car Crashes* 2005-2010 49 Crashes 186 Cars 58 Deaths • FYI: No Tornado Deaths in CA History • 75% of Deaths • Did Not Occur • on I-5/Hwy 99 • *Does not include car-train collisions
How do we “see” fog? Location of Fatal Fog-Related Car Crashes 2005-2010 60% of Deaths Occurred Within 10 Miles of an ASOS Q: What was the ASOS vis when the crashed occurred? Don’t know (more analysis). • Q: How representative is the ASOS? • Probably not very, fog can show tremendous spatial discontinuities.
How do we “see” fog? …generally, we have a hard time “seeing” it.
How can we “better” “see” fog? 11-3.9µ & FLS
FLS Training at HNX • Great Coordination to get Setup! • VISIT Sessions, Brown Bag (all forecasters) • Shared Blog Posts • One-on-One & Frequent Prodding by SOO • Group Learning Process • Shared Research Results by SOO
FLS Satellite Product Verification Obtained hourly FLS data from UW Madison – CIMSS for an area over our CWA. Dates covered 1 November 2012 through 28 February 2013 (2,904 hours). Satellite
FLS Satellite Product Verification Obtained hourly AWOS/ASOS data from NCDC for nine stations in the San Joaquin Valley. Dates covered 1 November 2012 through 28 February 2013 (26,1362 station-hours). Elevation (m)
FLS Satellite Product Verification Daily mean of LIFR conditions, visibility only, at nine stations based on surface observations (frequency, dashed) and FLS (probability, solid). Generally, FLS under-estimate the occurrence of LIFR conditions, significantly in some instances, with an accurate temporal distribution (r=0.86).
How has FLS helped NWS Hanford? • Overall, the FLS data have been a BIG help to HNX operations. • Filled in observational gap/provide a tool to ascertain spatial extent of fog. • Utilized since Fall 2012.Limited use Winter 2013-14, least amount of fog on record! • Helped with aviation forecasts, allowedforecasters to be more proactive inissuing dense fog advisories. • Were used extensively whensupporting NASA DISCOVERY-AQmission in the San Joaquin Valleyduring January 2013. NASA P38 Orion Low Pass at KHNX
Communicating Fog – NWS Fog Tracker *** IN DEVELOPMENT ***Tule Fog Tracker *** IN DEVELOPMENT *** Recognizing the need for a tool to clearly communicate to customers where fog currently is and where it is expected to be, NWS Hanford is developing the Tule Fog Tracker. Generated in GFE, data from the GOES-R FLS products are used to depict where fog was/is while the latest forecast from the HRRR is used to show where fog will be. Data from the Tracker are provided in numerous formats for customer use, including KML, ascii grid, and PNG images. NWS forecasters utilize the Tracker to generate official Dense Fog Advisories. Now Fog Tracker FLS FLS FLS FLS FLS FLS FLS FLS HRRR HRRR HRRR HRRR HRRR HRRR HRRR HRRR HRRR HRRR HRRR HRRR HRRR HRRR HRRR
Is FLS Ready for Prime Time? • Yes! • Supplied training augmented with local efforts were adequate for staff preparation. • In HNX evaluations, FLS under forecast fog. (Additional calibration needed?) • Extremely helpful for Situational Awareness when traditional platforms (ASOS) did not capture event(s). • Further study needed on incorporating this data set with existing platforms . • Operational improvement in temporal resolution will be of great value. • Addition of a level below LIFR is needed (impacts are not common until vis drops below 500’).
Utilizing GOES-R FLS Data to Detect the Central Valley’s Deadliest Weather Phenomenon Satellite Proving Ground/User Readiness Meeting June 2014, Kansas City, MO Paul Iñiguez Science & Operations Officer/Meteorologist NOAA/NWS Hanford, CA
What is dense fog? NWS Hanford definition is visibility <1/4 mi (1300 ft). California Highway Patrol paces traffic at 500 ft or less. Area schools delay at 200-300 ft.
Fog in Central California LIFR <1SM VLIFR <1/2SM
Fog in Central California LIFR <1SM VLIFR <1/2SM
Temporal Distribution of Fog-Related Crashes in NWS Hanford Forecast Area 2005-2010 Local Time
Driving in The Fog – What Can I See? http://www.monash.edu.au/miri/research/reports/other/hfr12.pdf http://www.oregon.gov/ODOT/HWY/ACCESSMGT/docs/stopdist.pdf http://onlinemanuals.txdot.gov/txdotmanuals/rdw/sight_distance.htm
Driving in The Fog – How Fast Can I Stop? Stopping Sight Distance = f( ) Perception-Reaction Time, Vehicle Operating Speed, Braking Distance
Driving In The Fog - What Can I Spare? Visibility - Stopping Sight Distance = Spare Time Accounts for 90-95% of situations.
FLS Satellite Product Verification Satellite
Forecasting Fog – High-Res Models High-Resolution Rapid Refresh, 3km, Hourly http://rapidrefresh.noaa.gov/HRRR/
Forecasting Fog – High-Res Models High-Resolution Rapid Refresh, 3km, Hourly Will be verifying HRRR forecast from 1 November 2012 through 28 February 2013.