Download
1 / 41
410 likes | 501 Vues
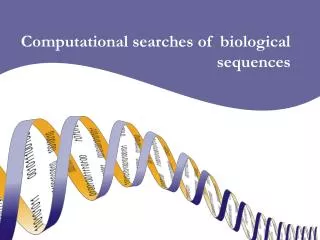
Explore the high-performance computational analysis of DNA sequences from varied environments, tools for efficient analysis, challenges faced, possibilities for speed optimization, and the correlation of uncertainty with sequence similarity and predictability of proteins.

E N D
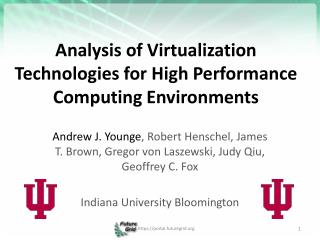
High performancecomputational analysis ofDNA sequences from different environments Rob Edwards Computer Science Biology edwards.sdsu.edu www.theseed.org
Outline • There is a lot of sequence • Tools for analysis • More computers • Can we speed analysis
How much has been sequenced? 100 bacterial genomes Environmental sequencing First bacterial genome 1,000 bacterial genomes Number of known sequences Year
How much will be sequenced? Everybody in USA Everybody in San Diego One genome from every species 100 people Most major microbial environments All cultured Bacteria
Metagenomics(Just sequence it) 200 liters water 5-500 g fresh fecal matter 50 g soil Concentrate and purify bacteria, viruses, etc Epifluorescent Microscopy Extract nucleic acids Sequence Publish papers
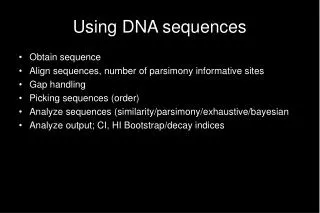
Outline • There is a lot of sequence • Tools for analysis • More computers
How much data so far 986 metagenomes 79,417,238 sequences 17,306,834,870 bp (17 Gbp) Average: ~15-20 M bp per genome ~300 GS20 ~300 FLX ~300 Sanger
Overall compute time ~19 hours of compute per input megabyte Hours of Compute Time Input size (MB)
How much so far 986 metagenomes 79,417,238 sequences 17,306,834,870 bp (17 Gbp) Average: ~15-20 M bp per genome Compute time (on a single CPU): 328,814 hours = 13,700 days = 38 years ~300 GS20 ~300 FLX ~300 Sanger
Outline • There is a lot of sequence • Tools for analysis • More computers • Can we speed analysis
Shannon’s Uncertainty • Shannon’s Uncertainty – Peter’s surprisal p(xi) is the probability of the occurrence of each base or string
Uncertainty in complete genomes Which has more surprisal: coding regions or non-coding regions? Coding regionsNon-coding regions
More extreme differences with 6-mers Coding regionsNon-coding regions
Can we predict proteins • Short sequences of 100 bp • Translate into 30-35 amino acids • Can we predict which are real and could be doing something? • Test with bacterial proteins
Kullback-Leibler Divergence Difference between two probability distributions Difference between amino acid composition and average amino acid composition Calculate KLD for 372 bacterial genomes
KLD varies by bacteria Colored by taxonomy of the bacteria
Most divergent genomes • Borreliagarinii–Spirochaetes • Mycoplasmamycoides– Mollicutes • Ureaplasmaparvum– Mollicutes • Buchneraaphidicola– Gammaproteobacteria • Wigglesworthiaglossinidia–Gammaproteobacteria
Divergence and metabolism Bifidobacterium Salmonella Bacillus Chlamydophila Nostoc Mean of all bacteria
Divergence and amino acids Ureaplasma Wigglesworthia Borrelia Buchnera Mycoplasma Bacteria mean Archaea mean Eukaryotic mean
Predicting KLD KLD per genome y = 2x2-2x+0.5 Percent G+C
Summary • Shannon’s uncertainty could predict useful sequences • KLD varies too much to be useful and is driven by %G+C content
Searching the seed by SMS AUTO SEEDSEARCHES 1 2 3 4 5 6 7 8 9 * 0 # seed search histidine coli @ 22 proteins in E. coli SEED databases GMAIL.COM ) ) edwards. sdsu. edu ) ) ) ) ) ) Anywhere Idaho GMCS429 Argonne
Challenges • Too much data • Not easy to prioritize • New models for HPC needed • New interfaces to look at data
Acknowledgements • SajiaAkhter • Rob Schmieder • Nick Celms • Sheridan Wright • Ramy Aziz • FIG • The mg-RAST team • Rick Stevens • Peter Salamon • Barb Bailey • Forest Rohwer • AncaSegall