Download
1 / 21
210 likes | 403 Vues
GEO 420 Project Land Use/Land Cover Analysis of S. California. General Idea of Projects The scenario You are working for either a private company, or government agency as a RS/DIP analyst.

E N D
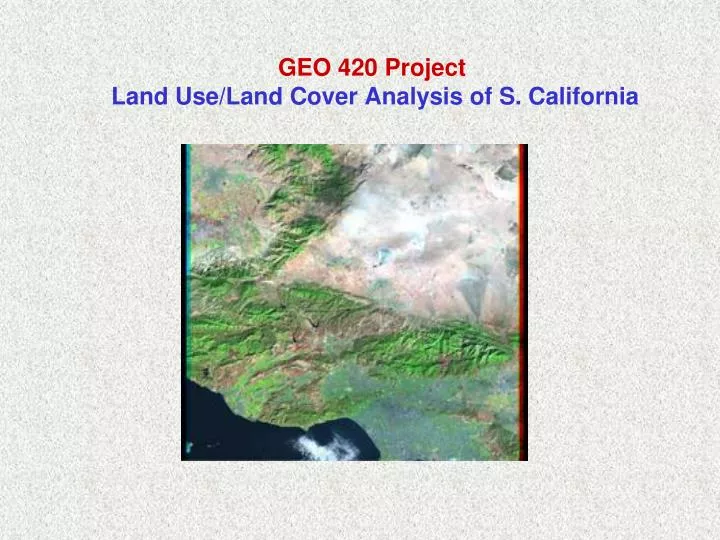
GEO 420 Project Land Use/Land Cover Analysis of S. California
General Idea of Projects • The scenario • You are working for either a private company, or government agency as a RS/DIP analyst. • Your boss has given you the lead responsibility on a project performing a Land Use/Land Cover Analysis of an area in S. California. • The final report will be sent to the local County Board of Supervisors for use in land use planning decisions.
You want to look at land use changes in your study area over time, so you are comparing two different years. • Your study area (subscene) should be roughly 50 x 50 miles. • The report is to be 4 pages of text (not including title page, abstract or references), plus figures and images.
The analyses for your 2 different years that you need to undertake and discuss (with figures) in your report includes: • 2 different pairs of color band ratio composites (year 1, year 2) • For example – A. NIR Composite for year 1 and year 2, B. True Color Composite for year 1 and year 2 • 2. A pair of unsupervised classifications (year 1, year 2) • 3. A pair of supervised classifications (year 1, year 2) • 4. A pair of NDVI indices (year 1, year 2)
5. Table 1: An NDVI comparison showing the % coverage of the different vegetation categories with a column showing the +- changes between years.
6. Table 2: A Supervised Classification comparison showing the % change in land cover results with a column showing the +- changes between years.
7. A pair of pie charts (or other graphic) showing percent land cover results of final supervised classifications (Year1 & Year 2 results from table above).8. Ground Truth Table of information for your 6 sites with 1 – 2 photographs that you took at each of your 6 sites.9. Choose 1 – 2 of the 4 - 5 Online figures (air photos, maps) that you used in your ground truth exercise.
Written Report Your report should be structured with the following sections: 1. Title Page 2. Abstract 3. Introduction/Background 4. Data & Methods 5. Results & Conclusions 6. References 7. All Figures/Photos/Tables
Written Report • All figures, tables, photos must be numbered and captioned. • All figures must be referenced and discussed within the text or they will not be considered part of the paper. • Report: 4 in length (not incl. title page, abstract, references page, or figures). • All figures go at end of document (print in color where appropriate).
Written Report • Introduction/Background.Begin with a thesis statement of what the project is about, and then should proceed to introduce it to the uninformed. Do not assume that your reader is familiar with your project or related topics (i.e., remote sensing or DIP), so do not get into specifics or too much technical detail in this section. Describe Study Area.
Thesis StatementsEvery paper, no matter how long or short, no matter its topic--even a book review--has a thesis.A thesis is a statement of purpose; the thesis gives the reader some idea, in capsule form, of just what it is that the writer intends the reader to learn from a particular piece of writing.
Written Report • Introduction/Background.Make it comprehensible to an informed layman (the readers are politicians, not scientists). Give enough background to enable them to place your particular research in a context of common knowledge (~1 ½ pages). • Include description of study area.
Written Report • Data & Methods.Now you can get into to the specifics of the data and the methods of analysis. What are your data sources, why did you choose the data you are using, what type of DIP operations have been done to your data to get it ready for you to analyze? What analysis methods did you use?, why? (~1 ½ pages).
Written Report • Results/Conclusions. Describe the results of your analyses. State what you found, refer to your figures/tables, etc. while doing so, then explain and assess the results. This section is often short, but very important and concisely written. (~1 page). • References. List a minimum of 5 references (texts, articles, web pages, ERDAS pdf documents, etc.) these must be referenced in text!
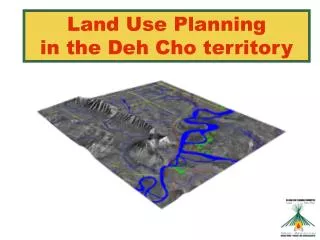
Mississippi 1990 2000