Download
1 / 28
290 likes | 647 Vues
Tracking Cosmic Ray Muons Using a Cloud Chamber. Leah Wilson and Lori Wilson duPont Manual High School and Dr. Akhtar Mahmood Bellarmine University. KAPT 2009 SPRING MEETING MARCH 7, 2009 BELLARMINE UNIVERSITY. Purpose and Hypothesis.

E N D
Tracking Cosmic Ray Muons Using a Cloud Chamber Leah Wilson and Lori Wilson duPont Manual High School and Dr. Akhtar Mahmood Bellarmine University KAPT 2009 SPRING MEETING MARCH 7, 2009 BELLARMINE UNIVERSITY
Purpose and Hypothesis • Cosmic rays are all around us, one type of cosmic ray that strikes the earth is a muon (µ). • On average, one muon strikes the fingertip every single minute. • In order to determine the muon flux count (number of muons hitting the earth’s surface in a given area per minute), a cloud chamber was constructed out of a basketball display case to determine the muon flux in the Louisville area. • This experiment was conducted at Bellarmine University in a Physics Lab. • The muon flux count obtained by our cloud chamber was also compared with the muon flux data obtained on-line from the Cosmic Ray Detector located at SLAC’s (Stanford Linear Accelerator Center) Visitor’s Center.
Background Information • The history of cosmic rays started in the beginning of the 20th century. • In 1912, Victor Hess was in his hot air balloon soaring at an altitude of about 5,000 meters. When he was sailing around he noticed “penetrating radiation” coming from outer space. • Following the ideas of Hess was Robert Millikan in 1925 who introduced the name “cosmic rays.” • In 1929 Dimitry Skobelzyn built the first cloud chamber to test the theory of cosmic rays.
Background Information • In 1935, the Explorer II balloon missionascended to 22,066 meters in space while collecting data about cosmic rays. • In 1937, Seth Neddermeyer and Carl Anderson discovered the muon using a cloud chamber. • In a major discovery in 1938, Pierre Auger discovered "extensive air showers" in the outer atmosphere. These showers were made up of secondary subatomic particles caused by the collision of high-energy cosmic rays with air molecules, which is now defined as a cosmic ray shower. • In 1947, Cecil Powell of Bristol University in the United Kingdom, discovered a new type of cosmic ray called the pion (). Explorer II balloon
Background Information (cont’d) • Most muons come from what are known as cosmic rays. A muon is roughly 200 times heavier than an electron. • There are two categories of cosmic rays: primary and secondary cosmic rays. • Primary cosmic rays can generally be defined as all particles that come to earth from outer space. • When these primary cosmic rays hit Earth's atmosphere, they ionize the atmosphere forming a shower of matter and anti-matter particles.
Background Information (cont’d) • This is where the muons come from: they are the results of an interaction between a proton (which are abundant in the universe) and the atmosphere that produces a pion that decays into a muon, among other particles. • Primary cosmic rays are particles such as a single proton (nuclei of hydrogen; about 90% of all cosmic rays) traveling through the interstellar medium. Most of these originate outside of the solar system (i.e. from Supernovae), but some of them come from the sun. • When such a high-energy proton hits the earth's atmosphere at around 30000m above the surface, it will collide with a nuclei of the atmospheric gas molecules. As a result of this collision, many secondary particles are produced, including lots of particles called pions.
Background Information (cont’d) • A (charged) pion decays to a muon and two muon-neutrinos (which is neutral therefore can not be seen) at about 10000m (10 km) altitude. • Some of these muons can make it through the earth's atmosphere which can be detected and measured using a suitable particle detector (such as a cloud chamber or a muon detector) at the earth's surface. In cosmic ray showers, both muons and anti-muons are produced. • Although the muon at rest has a lifetime of only 2.2 µs, it should have decayed after traveling a distance of only 660m. Thus one would conclude that muons produced at this high altitude of 10000m from earth should not reach the ground. • But muons can travel all the way down from a height of 10000m (10 km) above the surface of the earth while traveling at 99.8% the speed of light.
Background Information (cont’d) • The reason is that according to Einstein’s Special Theory of Relativity, the muons age more slowly (in fact, about 16 times) since they are traveling very fast at about 99.8% the speed of light. This effect is called “time-dilation.” • From the point of view of an observer on Earth the muon’s new lifetime can be determined from Einstein’s Special Theory of Relativity. • c = speed of light, v = speed of the muon which is 0.998c. (I.e. 99.8% the speed of light) and t0 = lifetime of muon at rest which is 2.2 x 10⁻⁶ s. • Thus this relativistic time dilation allows the muon to travel about 16 times farther (10000m instead of 657m) than would have been expected otherwise.
Background Information (cont’d) • We hypothesized that a using a cloud chamber, the muon flux count rate will be at least a factor of 10 or less since we are using our naked eye to detect the muon tracks instead of the sophisticated muon detector. • The latitudes of Palo Alto (37) and Louisville (38) are very close (within 1 of each other). • Whereas Palo Alto’s elevation is about 262 ft., and Louisville’s about 466 ft. The elevation of difference of about 200 ft should not result in any significant difference in the muon flux count rate except for the resolution of the two types of detectors.
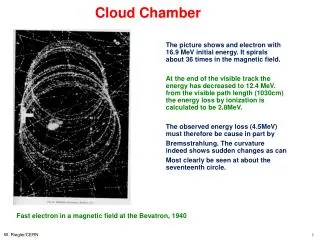
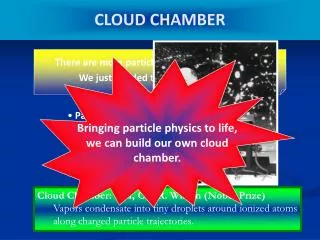
Background Information (cont’d) • When a charged particle passes through a particular substance it can ionize the surrounding particles and leave a trail. • For example, in a cloud chamber, the air is cooled to the point that when an atmospheric particle is ionized, it will cause the air to condense and thus leaves a visible trail. • The cloud chamber is essentially saturated with alcohol vapor. The dry ice keeps the bottom very cold, while the top is at room temperature. The high temperature at the top of the chamber means that the alcohol in the felt produces a lot of vapor, which falls downwards. The low temperature at the bottom means that once the vapor has fallen, it is supercooled. It is in a vapor form, but at a temperature at which vapor normally can't exist. Since the vapor is at a temperature where it normally can't exist, it will very easily condense into liquid form. • When an electrically charged cosmic ray comes along, it ionizes the vapor--that is, tears away the electrons in some of the gas atoms along its path. This leaves these atoms positively charged (since it removed electrons, which have negative charge). Other nearby atoms are attracted to this ionized atom. This is enough to start the condensation process.
Types of Cosmic Ray Muon Tracks • The Figure on the left is an example of a cosmic ray muon track. • The muon track can be seen coming straight which then "kinks" off to the left sharply after knocking off an electron from the atom in the material. Example of a Muon Track
Figure to the left is an example of a very jagged muon track. This is known as "multiple scattering", where a low-energy cosmic ray bounces off of one atom in the air to the next. • Figure to the left is the third example of a muon track. It shows a muon decaying into an electron and two neutrinos (actually one electron-neutrino and one anti-electron neutrino) Another Example of a Muon Track Yet Another Example of a Muon Track
Procedure • The cloud chamber was constructed to consistently produce an environment where muon tracks could be detected. • Felt pads were saturated with 91% isopropyl alcohol inside of the chamber (only on the top and bottom sides) with the goal of creating a super-saturated atmosphere of alcohol within the chamber. • The chamber was then set on a block of dry ice and was cooled to create the required environment for muon detection.
Procedure (cont’d) • To build the cloud chamber the following materials were needed - • A basketball display box, a conducting sheet of metal, silicon cement, razor blades, weather-strip, black felt, four push-pins, Windex, 91% pure isopropyl alcohol and paper towels. • First, we replaced the bottom of the display box with the thin sheet of conducting metal. We used silicon cement to ensure firm placement of the metal at the bottom. • Next, we took the same silicon cement and ran it around the inside and outside edges of the display box to make sure that no air will be able to get into the box when the experiment is going on.
Procedure (cont’d) • We placed the cloud chamber on top of the dry ice block and then turned off the lights and shone a high intensity light through the center/side of the chamber. • We waited for the fog to form at the bottom and begin to time the twenty minutes. • At every minute mark, we tallied the number of cosmic rays observed within the twenty minutes and repeated the experiment five times.
Results The cosmic ray muons detected in each 20 minute five trial run varied from 0 – 17. This figure shows the average number of muons per minute. This figure shows the same results, charted in a bar graph. This figure shows the average number of muons per minute in each trial.
Results (cont’d) These are the actual pictures of muons tracks that were detected inside the cloud chamber we built.
Conclusion • The experimental data supported the goal of this research project, which was to measure the muon flux in Louisville. • During a 100-minute time frame in 5 different trials, a total of 593 muons were observed or and average of about 119 muons per 20 minutes. Therefore we detected an average of 6 muons per minute. • The limitation of the experimental setup was the effective area of observation was about one-ninth of the size of the box, due to the location of the light source that was directed at the cloud chamber. • The chamber measured 30 cm (L) x 30cm (W), which equals an area of 900cm2, whereas the effective dimension of focus was about 10 cm (L) x 10cm (W) which gives the effective area of focus of about 100 cm2.
Conclusion (cont’d) SLAC Cosmic Ray Detector Data (Muon flux count rate)
Conclusion (cont’d) • The SLAC data shows that the muon flux in Palo Alto was anywhere from 0.3 - 0.9 muons/min/cm2 or an average muon flux of 0.6 muons/min/cm2 of during that time which corresponds to 60 muons/min/100cm2, to match with our effective area of observation which was about 100cm2. • Our hypothesis predicted that with a cloud chamber the expected resolution would be about ten times less (10% or less). • Our cloud chamber experiment detected a mean flux of 6 muons/min/100cm2 (or 0.06 events/minute/cm2) which was consistent with the hypothesis regarding the resolution of this experimental setup.
Awards and Recognition • March 7, 2008: • duPont Manual Science and Engineering Fair • 2nd Place Team in Physical Science
Awards and Recognition • March 29, 2008: • (KYSEF) Kentucky Science and Engineering Fair • Certificate for 1st Place Team • Trophy for Best of Fair high school Team Project • University of Kentucky Presidential Scholarship for 1st place prize in State Competition • University of Louisville Trustee Scholarship for 1st place prize in State Competition
Awards and Recognition • April 14, 2008: • Certificate of Recognition for duPont Manual High School Kentucky Science and Engineering Fair Winner presented by Jefferson County Board of Education
Awards and Recognition • April 19, 2008 • Kentucky Junior Academy of Science (KJAS) 1st Place Winner
Awards and Recognition • May 11-16 2008: • Finalist at the INTEL International Science and Engineering Fair • Certificate Presented by Agilent Technologies