
Uploaded by
cairo-walker
11 SLIDES
229 VUES
110LIKES
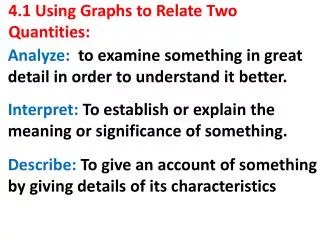
Interpreting Graphs to Relate Two Quantities
DESCRIPTION
This lesson focuses on interpreting graphs that illustrate the relationship between two quantities. Through a series of problems, students will practice analyzing various graphs to determine how changes in one quantity affect the other. Each problem is followed by a "Got it?" section to reinforce understanding. The homework assignment includes pages 237-238, covering problems 1 through 13, allowing students to further explore graph interpretations and enhance their analytical skills.
Download
1 / 11
Download Presentation

Télécharger la présentation
Interpreting Graphs to Relate Two Quantities
An Image/Link below is provided (as is) to download presentation
Download Policy: Content on the Website is provided to you AS IS for your information and personal use and may not be sold / licensed / shared on other websites without getting consent from its author.
Content is provided to you AS IS for your information and personal use only.
Download presentation by click this link.
While downloading, if for some reason you are not able to download a presentation, the publisher may have deleted the file from their server.
During download, if you can't get a presentation, the file might be deleted by the publisher.
E N D


More Related
Audio
Live Player