

E N D
Presentation Transcript
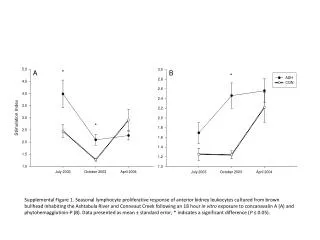
Supplemental Figure 1. Seasonal lymphocyte proliferative response of anterior kidney leukocytes cultured from brown bullhead inhabiting the Ashtabula River and Conneaut Creek following an 18 hour in vitro exposure to concanavalin A (A) and phytohemagglutinin-P (B). Data presented as mean ± standard error; * indicates a significant difference (P ≤ 0.05).
Supplemental Figure 2 – Microscopic appearance of macrophage aggregates in the spleen and liver of largemouth bass and brown bullhead. (A) Hepatic macrophage aggregates of brown bullhead (arrow). (B) Splenic macrophage arrogate (a) of largemouth bass replete with hemosiderin.
Supplemental Figure 3 – Microscopic appearance of hepatic lesions in brown bullhead. (A) Normal brown bullhead liver illustrating hepatopancrease tissue (a) that contains occasional bile ducts (arrows) within the hepatic parenchyma (b). (B) Bile duct proliferation (arrows). (C) Fibrosis (arrows) surrounding normal bile ducts. ((D) Altered cell foci (a) within the normal hepatic parenchyma(b), (E) Cholangioma, a benign neoplasm of the bile ducts (a). (F) Cholangiosarcoma, a malignant neoplasm of the bile ducts (a).
B A D C F E Supplemental Figure 4 - Seasonal comparison of reproductive end-points in brown bullhead collected from the Ashtabula River and Conneaut Creek. Gonadosomatic index (A, B) plasma 17β-estradiol (C, D) and testosterone (E, F) in in males and females respectively; mean ± standard error; * indicates a significant difference (P ≤ 0.05).
B A D C F E Supplemental Figure 5 - Seasonal comparison of reproductive end-points in largemouth bass collected from the Ashtabula River and Conneaut Creek. Gonadosomatic index (A, B) plasma 17β-estradiol (C, D) and testosterone (E, F) in in males and females respectively; mean ± standard error; * indicates a significant difference (P ≤ 0.05).
Supplemental Figure 6. Cumulative mean body burden of organochlorine and polyaromatic hydrocarbons in brown bullhead (A) and largemouth bass (B) collected from the Ashtabula River and Conneaut Creek during October 2003 and April 2004; mean ± standard error; * indicates a significant difference (P ≤ 0.05).