Download
1 / 1
10 likes | 110 Vues
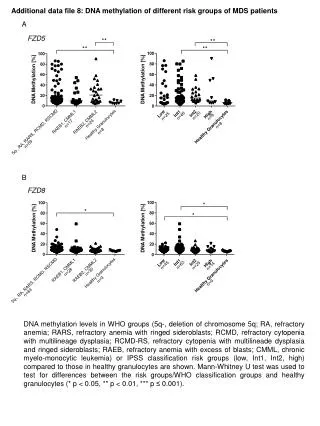
Explore DNA methylation levels in MDS patients categorized by risk groups and WHO classification compared to healthy granulocytes. Statistical analysis reveals significant differences. Study includes FZD5 and FZD8 data sets.

E N D
Additional datafile 8: DNA methylationof different riskgroupsof MDS patients A FZD5 ** ** ** ** n=20 n=46 n=9 n=25 n=8 RAEB2, CMML2 HealthyGranulocytes n=24 n=8 RAEB1, CMML1 5q-, RA, RARS, RCMD, RSCMD n=59 n=17 B FZD8 * * * n=63 n=45 n=25 n=14 n=9 RAEB1, CMML1 RAEB2, CMML2 HealthyGranulocytes n=30 n=28 5q-, RA, RARS, RCMD, RSCMD n=9 n=89 DNA methylation levels in WHO groups (5q-, deletion of chromosome 5q; RA, refractory anemia; RARS, refractory anemia with ringed sideroblasts; RCMD, refractory cytopenia with multilineage dysplasia; RCMD-RS, refractory cytopenia with multilineade dysplasia and ringed sideroblasts; RAEB, refractory anemia with excess of blasts; CMML, chronic myelo-monocytic leukemia) or IPSS classification risk groups (low, Int1, Int2, high) compared to those in healthy granulocytes are shown. Mann-Whitney U test was used to test for differences between the risk groups/WHO classification groups and healthy granulocytes (* p < 0.05, ** p < 0.01, *** p ≤ 0.001).