Download
1 / 37
370 likes | 519 Vues
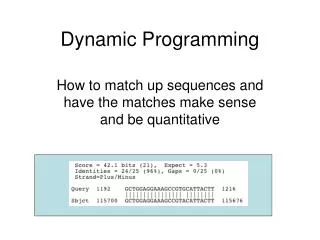
Images Similarity by Relative Dynamic Programming. M. Sc. thesis by Ady Ecker Supervisor: prof. Shimon Ullman. Overview. The similarity problem The Method: Overlapping patches Combining evidences Relative dynamic programming Analysis. Part 1: The Problem. Old problem. Important.

E N D
Images Similarity by Relative Dynamic Programming M. Sc. thesis by Ady Ecker Supervisor: prof. Shimon Ullman
Overview • The similarity problem • The Method: • Overlapping patches • Combining evidences • Relative dynamic programming • Analysis
Part 1: The Problem
Old problem. Important. Difficult. Natural to humans. The similarity problem
What is similarity? • Similarity has many aspects, e.g. shape, color, size, outline, texture. • Relative and context dependent. • Depends on experience with classes in the real world.
Similarity is not a metric Minimality Triangle inequality Symmetry
Previous approaches to similarity computation • Distance functions (L2, correlation). • Features detection, image signatures. • Minimal energy aligning transformation. • Dynamic programming measures. • Overlapping fragments (Ullman and Sali).
Motivation • Point-wise methods fail on very simple examples.
Motivation • We propose: common substructures of multiple sizes at multiple scales.
B2 B1 A1 A2 C1 C2 Similarity of sub-patchesat the local level A1 A2 B1 B2 C1 C2
Part 2: The method
Overlapping sub-patches • overlapping fragments impose similar structure.
Hierarchical decomposition • Allows the sub-patches to move a little.
Similarity indicators • Each indicator has its marginal distribution, but the joint distribution is too complex. • The indicators are dependent. FX X normalization by 1-D distribution
Generalization groups example 45º length ratio 2 The similarity is related to the intersection of the groups:Pr( (A,B) length ratio ratio(A,B) )
z F 1 1 z F (x3,y3) 1 (x0,y0) (x0,y0) (x1,y1) (x1,y1) z F z F z (x,y) F z 0 0 area zprob. F F 0 1 0 1 0 0 1 Graphical illustration of the similarity score independent case estimation error general case
Empirical example • 10,000 points from 2D normal distribution. • Normalization:x → Pr ( X x )y → Pr ( Y y ) • Only 233 points between the two curves.
x1 y1 x2 z y2 x3 The similarity score • The score combines several similarity indicators. • The score is relative. • Since the score is normalized, it can be used in hierarchical construction:
Dynamic programming in 2D? Vertical movement Horizontal and vertical movements
Relative Dynamic Programming (RDP) • Works in 2D like dynamic programming algorithms, but: • Scores are relative. • No explicit objective function. • Start from many points simultaneously.
The similarity table T(i,d) D(x,x+3) D(x,x+2) 3 D(x,x+1) 2 D(x,x) 1 I1 I2 0 -1 D(x,x-1) D(x,x-2) -2 D(x,x-3) -3 x x
projected index delta The minima table • Allow flexible movements. • Costs keep movement coherence. • Used for efficiency. • Bi-directional (two tables).
Flowchart Basic similarity measure Input images Set patch size = 2 Geometric mean of sub-patches' scores Store scores in similarity table Double the patch size Build minima tables No Patch size = N? Normalization Yes Output the similarity score
Multi-scale • Two dimensions, cross-resolution: T(r,z,i1,i2,d1,d2)=min(P, Vhigh-low, Vlow-low) Vlow-low low resolution: Vhigh-low P high resolution:
Distributions • Distributions are sampled empirically. • The sampling is done layer by layer. distribution of the weighted geometric mean of real images distribution of the geometric mean of independent uniform variables
Part 3: Analysis
Performance • The complexity is O(N2D2). • The number of operations is governed by the operations on the original resolution. • Basic-similarity operations: 3232171716 4,735,000. • Minima operations: 3232171792 5,327,000. • Total 10,000,000. • Takes a second on 1.5GH p.c.
Results L2 RDP correlation
Experimental conclusions • The algorithm is superior to point-wise distance functions (L2, correlation), even when the images are aligned by a global transformation. • The current implementation neglects important parts such as outlines and topology.
Qualitative properties • Similarity by parts. • Captures variety of transformations. • Weights the salient parts. • Adaptive to distributions in the domain.
Properties of the design • Robust. • Simple operations. • Can be implemented in parallel and neural-networks. • Intuitive. • Extendible to deal with many aspects of similarity.
Summary • We presented a new scheme to the similarity problem in general. • The scheme is based on the systematic evaluation of similarity on overlapping sub-patches. • Scores are relative. Scores are combined hierarchically using empiric normalizations. • The implementation captures aspects of perceptual similarity, but is still inferior to human’s judgment.
The End