Download
1 / 37
370 likes | 473 Vues
The Role of Tropical Forests in the Regional and Global Hydroclimate Roni Avissar W.H. Gardner Professor and Chair Department of Civil & Environmental Engineering Duke University and R. Ramos da Silva, D. Werth, S. Badya Roy Duke University May 10, 2005. 9.5 10.5. 8 9 10 11 12 13.

E N D
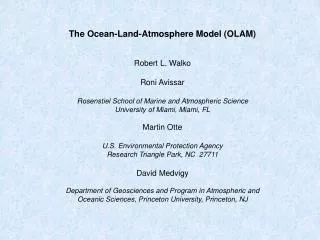
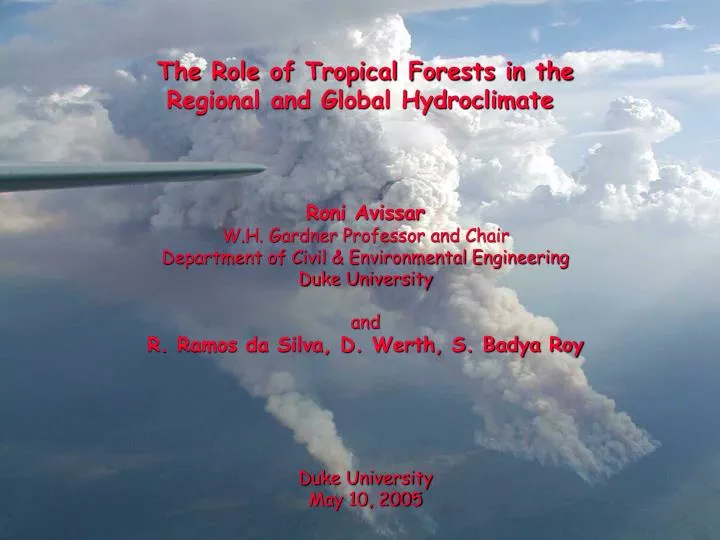
The Role of Tropical Forests in the Regional and Global Hydroclimate Roni Avissar W.H. Gardner Professor and Chair Department of Civil & Environmental Engineering Duke University and R. Ramos da Silva, D. Werth, S. Badya Roy Duke University May 10, 2005
9.5 10.5 8 9 10 11 12 13 Porto Velho 63 62 Cuiaba 65 64 63 62 61 60 8 13 65 60 Our overall objective is to understand the impact of land-cover change on the local, regional, and global hydroclimate.
9.5 10.5 8 9 10 11 12 13 Porto Velho 63 62 Cuiaba 65 64 63 62 61 60 8 13 65 60
Low Pressure High Pressure Low Pressure Low Density
Low Pressure High Pressure Low Pressure
High Pressure Low Pressure High Pressure
Clouds at 3 p.m. (from GOES) w (m/s) at 3 p.m., 500 m
We use the data collected during the joint “Wet Atmospheric Mesoscale Campaign – TRMM validation (WetAMC – TRMM),” in January – February 1999. 8 9 10 11 12 13 65 64 63 62 61 60
8 9 10 11 12 13 65 64 63 62 61 60
Average Precipitation Rate (mm/hr) RAMS (400 m) S-POL (4 km)
a & e – February 4, 1999 b & f – February 6, 1999 c & g – February 14, 1999 d & h – February 23, 1999 S-POL Control RH test Soil Moisture test Grid Size test
Current deforestation pattern 10.76 mm (daily mean accumulation) No deforestation 7.94 mm (daily mean accumulation) 36% increase in the daily mean accumulation!
Amazon Basin Landscape Scenarios 2001 2030 Forest Cerrado 2050 Final
A Global Climate Model (GCM) assumes flat terrain and homogeneous land cover Current deforestation pattern 10.76 mm (daily mean accumulation) No deforestation 7.94 mm (daily mean accumulation) Current deforestation pattern 6.75 mm (daily mean accumulation) 36% increase in the daily mean accumulation! With the GCM, 15% decrease in the daily mean accumulation!
OBSERVATIONS RAMS
1998 1999 2000 Total – C 2051 - C 2031 – C
? The Issue...
Five ensembles of six, 12-year realizations were performed with the NASA-GISS GCM (with imposed monthly mean sea-surface temperatures): • Control – land-cover in early 70’s, before intensive deforestation started (Matthews, 1983); • Amazonian deforestation; • Central African deforestation; • South-Eastern Asian deforestation; • All three tropical regions deforested simultaneously (i.e., “total” deforestation). • Control case is compared to Cases (2) – (5). Each grid point is tested for monthly, ensemble mean, statistically significant difference in precipitation.
PRECIPITATION [mm/day] Amazonia vs Control
PRECIPITATION [mm/day] Africa vs Control
The Luni-Solar Oscillation (LSO) affects tides, which affect SSTs and, as a result, the amount of water evaporated from the ocean that is then advected into the basin, where it precipitates.
Conclusions • The atmospheric boundary layer is significantly affected by landscape structure. Frequently, landscape heterogeneity created by land use generates horizontal pressure gradients strong enough to create and sustain organized mesoscale circulations, which can trigger thunderstorm activity. In tropical regions, this happens in all seasons; • Tropical deforestation significantly affects the regional hydroclimatology of these regions and, to a lesser but still quite significant degree, the mid-latitude hydroclimatology (e.g., the US Midwest and the Arabian Peninsula). Among tropical regions, the Amazon Basin seems to have the largest impact, probably due to the fact that its dry season lasts longer and is dryer than in Central Africa and South-East Asia; • Simultaneous deforestation of Amazonia, Central Africa and South-East Asia has a cumulative impact in a few regions (notably, in the Arabian Peninsula) and synergistic impact in others (including in the US by shifting the main impact to California); • Convective activity is one of the key factors that triggers teleconnections between tropical regions and higher latitudes but our GCMs do not account for (mesoscale) landscape-generated convection. Clearly, this limits our capability to estimate the real magnitude of teleconnections between tropical rainforests and the rest of the world; • Inter-decadal variability is associated with the LSO, which is a deterministic, very predictable signal. Thus, it improves the predictability of the Amazonian hydroclimate system and it should be included in new earth system models.