V. Capacity Planning in Services
280 likes | 315 Vues
This comprehensive guide explores matching supply and demand in service processes, covering performance measures, causes of waiting, economics of waiting, and strategies for managing waiting time. Using case studies and examples, it delves into various service facilities like call centers, hospitals, and retail outlets, providing insights on operational and financial performance metrics.

V. Capacity Planning in Services
E N D
Presentation Transcript
V. Capacity Planning in Services • Matching Supply and Demand • The Service Process • Performance Measures • Causes of Waiting • Economics of Waiting • Management of Waiting Time • The Sof-Optics Case
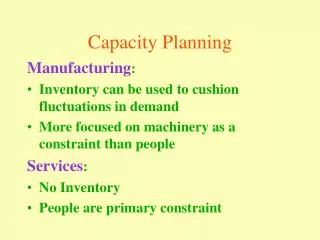
Matching Supply and Demand • Goods vs. Services • Make to Stock vs. Make to Order • Produce in advance vs. on demand • Safety Inventory vs. Safety Capacity • Examples • Banks (tellers, ATMs, drive-ins) • Fast food restaurants (counters, drive-ins) • Retail (checkout counters) • Airline (reservation, check-in, takeoff, landing, baggage claim) • Hospitals (ER, OR, HMO) • Call centers (telemarketing, help desks, 911 emergency) • Service facilities (repair, job shop, ships/trucks load/unload)
The DesiTalk Call Center The Call Center Process Sales Reps Processing Calls (Service Process) Incoming Calls (Customer Arrivals) Answered Calls (Customer Departures) Calls on Hold (Service Inventory) Blocked Calls (Due to busy signal) Abandoned Calls (Due to long waits) Calls In Process (Due to long waits)
The Service Process • Customer Inflow (Arrival) Rate (Ri) • Inter-arrival Time = 1 / Ri • Processing Time Tp • Processing Rate per Server = 1/ Tp • Number of Servers (c) • Number of customers that can be processed simultaneously • Total Processing Rate (Capacity) = Rp= c / Tp • Buffer Capacity (K) • Maximum Queue Length
Operational Performance Measures • Flow time T = Ti+ Tp • Inventory I = Ii + Ip • Flow Rate R= Min (Ri, Rp) • Stable Process = Ri< Rp,, so that R= Ri • Little’s Law: I = Ri T, Ii = Ri Ti, Ip = Ri Tp • Capacity Utilization = Ip/ c = Ri Tp / c = Ri / Rp < 1 • Safety Capacity Rs = Rp - Ri • Number of Busy Servers = Ip= c = Ri Tp • Fraction Lost Pb= P(Blocking) = P(Queue = K)
Financial Performance Measures • Sales • Throughput Rate • Abandonment Rate • Blocking Rate • Cost • Capacity utilization • Number in queue / in system • Customer service • Waiting Time in queue /in system
Flow Times with Arrival Every 4 Secs What is the queue size? What is the capacity utilization?
Flow Times with Arrival Every 6 Secs What is the queue size? What is the capacity utilization?
Effect of Variability What is the queue size? What is the capacity utilization?
Effect of Synchronization What is the queue size? What is the capacity utilization?
Conclusion • If inter-arrival and processing times are constant, queues will build up if and only if the arrival rate is greater than the processing rate • If there is (unsynchronized) variability in inter-arrival and/or processing times, queues will build up even if the average arrival rate is less than the average processing rate • If variability in interarrival and processing times can be synchronized (correlated), queues and waiting times will be reduced
Summary: Causes of Delays and Queues • High Unsynchronized Variability in • Interarrival Times • Processing Times • High Capacity Utilization r = Ri / Rp, or Low Safety Capacity Rs= Rp – Ri, due to • High Inflow Rate Ri • Low Processing Rate Rp = c/Tp
The Queue Length Formula Utilization effect Variability effect x where Ri / Rp, where Rp = c / Tp, and Ciand Cp are the Coefficients of Variation (Standard Deviation/Mean) of the inter-arrival and processing times (assumed independent)
Average Flow Time T Variability Increases Tp 100% r Utilization (ρ) Throughput- Delay Curve
Computing Performance Measures • Given • Interarrival times: 10, 10, 2, 10, 1, 3, 7, 9, and 2 • Processing times: 7, 1, 7, 2, 8, 7, 4, 8, 5, 1 • c = 1 • Compute • Capacity Utilization r = Ri / Rp = 0.833 • Ci = 3.937/6 = 0.6562 • Cp = 2.8284/5 = 0.5657 • Queue Length Formula • Ii = 1.5633 • Hence • Ti = Ii / R = 9.38 seconds, and Tp= 5seconds, so • T = 14.38 seconds, so • I = RT = 14.38/6 = 2.3966
Effect of Increasing Capacity • Given • Interarrival times: 10, 10, 2, 10, 1, 3, 7, 9, and 2 • Processing times: 7, 1, 7, 2, 8, 7, 4, 8, 5, 1 • c = 2 • Compute • Capacity Utilization r = Ri / Rp = 0.4167 • Ci = 3.937/6 = 0.6562 • Cp = 2.8284/5 = 0.5657 • Queue Length Formula • Ii = 0.07536 • Hence • Ti = Ii / R = 0.45216 seconds, and Tp= 5seconds, so • T = 5.45216 seconds, so • I = RT = 5.45216/6 = 0.9087
The Exponential Model • Poisson Arrivals • Infinite pool of potential arrivals, who arrive completely randomly, and independently of one another, at an average rate Ri constant over time • Exponential Processing Time • Completely random, unpredictable, i.e., during processing, the time remaining does not depend on the time elapsed, and has mean Tp • Computations • Ci =Cp= 1 • If c = 1, T = 1/(Rp Ri), then I = Ri T,... • If c ≥ 2, and K < ∞ , use Performance.xls
Example • Interarrival time = 6 secs, so Ri = 10/min • Tp = 5 secs = 0.833 mins
Synchronization • Matching Capacity with Demand • Capacity • Short term Control • Long term Planning • Demand • Pricing • Scheduling
Performance Improvement Levers • Capacity Utilization / Safety Capacity • Demand Management (arrival rate) • Peak load pricing • Increase Capacity (processing rate) • Number of Servers (scale) • Processing Rate (speed) • Variability Reduction • Arrival times • Scheduling, Reservations, Appointments • Processing times • Standardization, Specialization, Training • Synchroniztion • Matching capacity with demand
Server 1 Queue 1 Server 2 Queue 2 Effect of Pooling Ri/2 Ri Ri/2 Server 1 Ri Queue Server 2
Effect of Buffer Capacity • Process Data • Ri = 20/hour, Tp = 2.5 mins, c = 1, K = # Lines – c • Performance Measures
Economics of Capacity Decisions • Cost of Lost Business Cb • $ / customer • Increases with competition • Cost of Buffer Capacity Ck • $/unit/unit time • Cost of Waiting Cw • $ /customer/unit time • Increases with competition • Cost of Processing Cs • $ /server/unit time • Increases with 1/ Tp • Tradeoff: Choose c, Tp, K • Minimize Total Cost/unit time = Cb Ri Pb + Ck K + Cw I (or Ii) + c Cs
Optimal Buffer Capacity • Cost Data • Cost of telephone line = $5/hour, Cost of server = $20/hour, Margin lost = $100/call, Waiting cost = $2/customer/minute • Effect of Buffer Capacity on Total Cost
Performance Variability • Effect of Variability • Average versus Actual Flow time • Time Guarantee • Promise • Service Level • P(Actual Time Time Guarantee) • Safety Time • Time Guarantee – Average Time • Probability Distribution of Actual Flow Time • P(Actual Time t) = 1 – EXP(- t / T)
Flow Time Management: Review • Waiting occurs due to • low processing capacity in relation to the inflow rate • variability in inter-arrival and processing times • Waiting can be reduced by • managing demand • pooling arrival streams • increasing capacity (number of servers service rate) • reducing the variability in arrivals and processing • Optimal level of service involves a tradeoff • cost of waiting, lost business and cost of service
Flow Time Management Levers • Manage Arrivals • Demand Management: Price incentives • Pool arrivals • Increase Capacity • Scale: Servers, Part-timers, customer participation • Speed: Simplify, Automation, Information, Training • Decrease Variability • Arrivals: Forecast, Reservations, Pooling • Processing: Standardize • Reduce Impact of Waiting • Comfortable, Distract, Entertain, Perception