
1CO
1CO. II. II. I. I. II. II. I. I. II. I. EN. Col. 9A OE. irx2-2. Ws. kor1-1. 80. 800. *. 70. 700. Xylem. Phloem. 60. 600. *. Periderm. 50. 500. µm. 40. 400. % of xylem II in secondary xylem. 30. 300. 200. 20. 100. 10. 0. 0. Col. 9A OE. irx 2-2. Ws.

1CO
E N D
Presentation Transcript
1CO II II I I II II I I II I EN Col 9A OE irx2-2 Ws kor1-1 80 800 * 70 700 Xylem Phloem 60 600 * Periderm 50 500 µm 40 400 % of xylem II in secondary xylem 30 300 200 20 100 10 0 0 Col 9A OE irx 2-2 Ws kor1-1 Col 9A OE irx2-2 Ws kor1-1 (a) Figure S3 - Takahashi et al. I (b) (c) * * * * * *
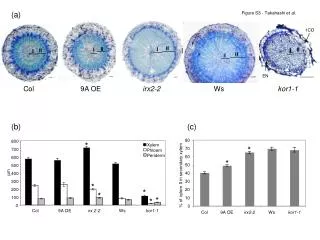
Figure S3. Expression of PttCel9A1/KOR1 effects secondary anatomy of hypocotyls. PttCel9A1 OE lines (5 independent lines shown in Figure 4; 9A OE), irx2-2 and kor1-1 mutants were grown at 22°C under SD condition for four weeks and LD for seven weeks to generate extensive secondary xylem. (a) Transverse sections of hypocotyls. Secondary xylem phases I and II are indicated. Bar = 100 um, EN - endodermis; 1CO - primary cortex. (b) The amount of total secondary xylem (black bars), phloem (white bars) and periderm (gray bars) measured along the radius in hypocotyl transverse section. (c) PttCel9A1/KOR1 excess and deficiency increase the proportion of xylem II in the total secondary xylem. Averages ± SE, N = 20 for Col, 9A OE and irx2-2, and N = 12 for WS and kor1-1. Averages significantly different from WT (Duncan test, P ≤ 0.05) are marked with asterisks. Experimental procedures: 3-5 mm long segments of hypocotyls were fixed in 4% paraformaldehyde and 0.05% glutaraldehyde (Analytical standards AB, Sweden) in 25 mM phosphate buffer, pH 7.2, for 24 hrs, dehydrated in a graded ethanol (30, 50, 70, 80, 90, 95, 100) series and embedded in LR White resin (TAAB, UK). 2 µm thick transverse sections were cut with a rotary microtome (Microm HM 350, Carl Zeiss, Germany), transferred to slides and stained in 0.02% toluidine blue O (Sigma-Aldrich, USA) for 2 min, rinsed in distilled water and mounted in entellan (Merck KGaA, Germany).