Download

1 / 5
60 likes | 198 Vues
This report, researched and prepared by Mindy Trask, Environmental Project Manager at ODOT, explores Oregon's waste management landscape. It reveals that commercial businesses generate approximately 44% of waste in the state, with 25% of that being recyclable paper. It highlights the environmental impact of recycling, such as saving over 500 trees every half hour. Additionally, it discusses waste recovery methods, incineration facilities, and the importance of reducing landfill waste through recycling and waste prevention efforts. Together, we can make a difference for our environment.

E N D
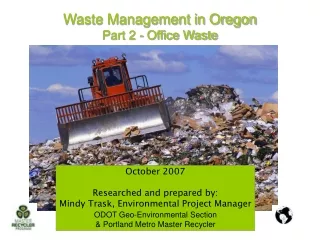
Waste Management in Oregon Part 1 - The Background October 2007 Researched and prepared by: Mindy Trask, Environmental Project Manager ODOT Geo-Environmental Section & Portland Metro Master Recycler
Oregon Waste Composition (2002 DEQ Data) Commercial businesses (that includes offices like yours) generate about 44 % of all waste in Oregon. Commercial Waste Composition • 25 % of the garbage that businesses discard) is paper that is fully recyclable. • This is 120,000+ tons a year. • Recycling this amount of paper would save the equivalent of more than 500 trees every half hour!
Greenhouse Gas Sources and Sinks Associated with the Material Life Cycle (production, transportation, use, and disposal) by David Allaway, DEQ, 2006.
Where Does It All Go?? Other local landfills are located throughout the state. • 45% of Oregon's waste is recovered (reused, remanufactured, recycled, compost, incineration) • Two facilities in OR burn 4.2% of Oregon’s disposed municipal waste: • Brooks Energy Facility in Marion County uses the energy from burning waste to generate electricity. • Beaver Hill Incinerator in Coos County burns waste for disposal. • Remaining 50% is land-filled, usually trucked long distances.
The Bad & Good News • Average daily waste generation per person in industrialized nations: • US 4.6 lbs (Oregonians same as US) • Canada 3.75 lbs • Netherlands 3 lbs • Germany 2 lbs • Sweden 2 lbs (source: EPA “find an answer” website) • Total generation of solid waste (garbage & recycling) increased 70% between 1993 and 2005. • Population growth accounts for only a portion of that increase. • On a per-capita basis Oregonians sent 43% more to be recycled, composted, or disposed in 2005 than 2 years earlier. (Source: DEQ statistics) You can make a difference! Benefits of recycling and waste prevention: • Conserves natural resources • Saves energy • Reduces greenhouse gas emissions responsible for global warming • Reduces landfill waste • Saves resources used to transport and manage garbage