Download
1 / 29
290 likes | 475 Vues
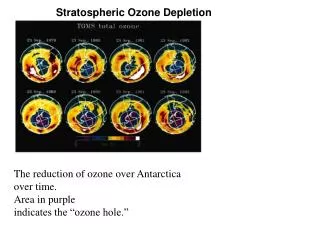
Ozone Modeling over the Western U.S. -- Impact of National Controls on Ozone Trends in the Future. Rural/Urban Ozone in the Western United States -- March 10, 2004 Pat Dolwick, Carey Jang, Sharon Phillips U.S. EPA – Office of Air Quality Planning and Standards. Purpose/Outline. Purpose:

E N D
Ozone Modeling over the Western U.S. -- Impact of National Controls on Ozone Trends in the Future Rural/Urban Ozone in the Western United States -- March 10, 2004 Pat Dolwick, Carey Jang, Sharon Phillips U.S. EPA – Office of Air Quality Planning and Standards
Purpose/Outline • Purpose: • Present some limited results from EPA ozone modeling simulations estimating future trends in ozone over the western U.S. • Outline: • Expected ozone trends over western U.S. • Modeling ozone in the western U.S. w/ CMAQ • Effect of intercontinental transport on ozone
Expected Ozone Trends – Federal Emissions Reductions • Eastern U.S. EGU NOx controls • Modeling studies have shown impacts from eastern U.S. NOx in Big Bend N.P. and Dallas. • Total NOx reduction of ~ 28%, beginning 5/03 • Tier 2 / Gasoline Sulfur • Issued in 2000 • SUVs, light trucks, vans subject to same emissions standards as cars (0.07 gpm NOx) • 77-95% less NOx emissions from category • Effective in model year 2004, phase in (07/09)
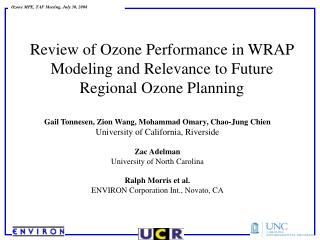
Contribution to High Ozone in the Dallas Region 1 1 1 1 1 3 1 4 1 2 3 10 70 CAMx source apportionment: Source: IAQR
Expected Ozone Trends – Federal Emissions Reductions • Heavy Duty Engine & Diesel Sulfur • Issued in 2001 • Emissions standards for heavy-duty trucks and buses, plus fuel sulfur limits • 95% less NOx emissions from category • Effective in model year 2006/07, phase in (09/10) • NonRoad Engine & Diesel Sulfur • Proposed in 2003, Expected final in April 2004 • Emissions standards for construction, agricultural, and industrial equipment • 90% less NOx emissions from category • Effective in model year 2008, phase in through 2014
Expected Ozone Trends – NonRoad Modeling Analyses • CAMx, v3.10 • 36/12 km • 11 layers, 4.8 km • Two July 96 episodes (25 days) • 2020 base/control • 2030 base control
Expected Ozone Trends – NonRoad Modeling Analyses • Mean normal. bias = -21% • Gross error = 26% • Improvement from Tier 2 • CARB Emissions • BEIS3 Emissions • Only 3 subregions met EPA recommended targets, but went forward w/ analysis given use of model in relative mode.
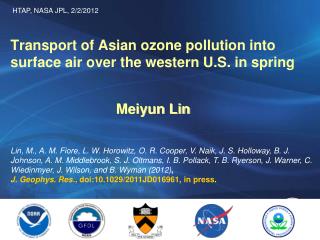
Expected Ozone Trends – NonRoad Modeling Analyses • Most portions of the western U.S. are projected to have a reduction of 2-10 ppb in peak 8-hr ozone levels by 2020 • Greater reductions in majority of CA • Disbenefits in LA, SF, DEN (small) & PHX (small)
Expected Ozone Trends – NonRoad Modeling Analyses • Most portions of the western U.S. are projected to have a reduction of 2-10 ppb in peak 8-hr ozone levels by 2030 • Greater reductions in majority of CA • Disbenefits in LA, SF, & PHX
Expected Ozone Trends – Relative Reduction Factors • Use relative change in model ozone (base vs. future) in conjunction with present-day design values to estimate the design value in the future. • NR analyses used 1999-2001 ambient data • For this presentation, used preliminary 2001-2003 ambient data • Only uses predictions >= 70 ppb • Compares 9-cell average, multi-day mean, 8-hr max • Explained in more detail in EPA 8-Hour modeling guidance
Expected Ozone Trends – NonRoad Modeling Analyses • 8-hour ozone levels are generally expected to decrease slightly in the Western U.S. over the next 10-25 years • Decrease of ~ 5%: Albuquerque, Denver, Phoenix, Salt Lake City, Tucson, & rural areas • Larger decreases: Portland, Seattle • Model results uncertain (your results may vary) • Certain Western U.S. cities are likely to maintain design values near/just below the NAAQS over the next 0-20 years w/o local control • – will depend on year-to-year meteorological variability.
CMAQ Western U.S. Ozone Modeling • EPA has modeled ozone over the western U.S. using several model configurations • Proof of Concept (left): 1996 episode, 36/12km, 2001 release of CMAQ • Continental U.S.: entire year of 1996, 36km, 2002 release of CMAQ • Continental U.S.: entire year of 2001, 36km, 2004 release of CMAQ, in progress
CMAQ Western U.S. Ozone Modeling – 1996 Application • Model performance evaluation indicated greater negative bias in the western U.S. in the summer than in 36/12 CAMx • Mean normalized bias = -11.7% • Normalized gross error = 23.2 % • East US (annual): bias = -1.2%; error = 18.6% • West US (annual): bias = -26.5%; error = 29.9% • East US (summer): bias = 0.8%; error = 18.7% • West US (summer): bias = -27.0%; error = 30.5%
CMAQ Western U.S. Ozone Modeling – 1996 Application • RRF-derived estimates of future design values differ across 3 models • CMAQ and CAMx are more similar than REMSAD • In future, EPA hopes to consolidate ozone and PM modeling into a single, comprehensive modeling platform
Effect of Intercontinental Transport – Sensitivity Tests • Default BCs/ICs : EPA Default Profile v6b • Ozone = 35 ppb • GCMx (GEOS-CHEM + Default) BCs/ICs : 21 key species from “GEOS-CHEM” + the rest from “Default” (Needed for CMAQ runs) • Ozone ~ 10-25 ppb (surface) • Ozone ~ 200 ppb (top model layer, 400-100 mb) • Highlights of differences using GCMx BCs/ICs • July 2001 (monthly avg.): • Lower O3 (3~10 ppb) over the west coast • Moderately higher PM 2.5 (mainly PM sulfate) over U.S.
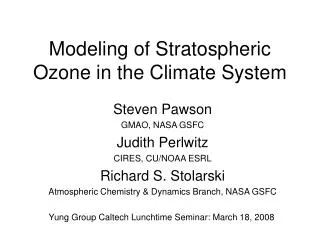
O3 diff.(GEOS/CHEM BCs/ICs – Default BCs/ICs) D O3 D O3 (%) (July monthly avg., 2001) Source: Jang (2004), personal communication
O3 diff.(GCM BCs/ICs – Default BCs/ICs) D O3 (daily avg.)D O3 (8-hr max) (July 22, 2001) Source: Jang (2004), personal communication