Download
1 / 50
500 likes | 705 Vues
Energy & Electricity. History of Electricity/Grid. Electricity “system” created in US 1881 Purpose was electricity for lights 1881 cost: $0.24/kWh! (now ~$0.10) Early 1900’s: inter-city transmission lines 1930s-1950s: rural electrification, federally-run electric generating plants (hydro)

E N D
History of Electricity/Grid • Electricity “system” created in US 1881 • Purpose was electricity for lights • 1881 cost: $0.24/kWh! (now ~$0.10) • Early 1900’s: inter-city transmission lines • 1930s-1950s: rural electrification, federally-run electric generating plants (hydro) • 1950s- now: nuclear power, environ. controls, fuel costs, Three Mile Island
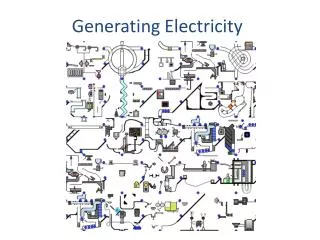
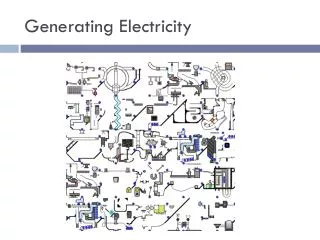
For wind & hydro, skip step 1 For PV solar skip 1 and 2 “Making” electricity (2) Turbine Generator (3) steam, water, air Boiler (1) coal, natural gas, nuclear fission, wood, solar energy
Making electricity not efficient http://www.energy.qld.gov.au/electricity/infosite/elec&env7/roleofenergy7_3/efficiencyinpowerstat/energylosses/energylosses.htm Doesn’t include losses along transmission lines, another 5-10%
Pros Cheap Abundant New technologies to help with emissions Cons Resource finite Emissions Carbon SOx NOx Particulate Matter Mercury Mining Health & environment Transportation Coal-fired electricity
Pros Cleaner than coal Dispatchable “Combined cycle” makes plants more efficient Cons Costs variability & uncertainty Emissions Supply questionable Natural gas
Pros No CO2 emissions Cheap? Abundant fuel 3% of all topsoil is U235 Cons Cheap? High impact/low occurrence risk No closure to life cycle Waste, Yucca mountain Security Nuclear power
Pros Emissions very low Opportunity for storage Cheap Flood control Water supply Cons Devastating to wildlife and surrounding area Owner has control of the river downstream Dependent on weather Hydroelectric power
Pros Low emissions Resource requirements low Energy independence Cons Costs Intermittency Location Not necessarily renewable “Renewables”Solar, Wind, Thermal, Tidal
What’s your consumption mix? • Consumption mix: the fraction of each type of generation a specific region, state, business, or individual consumes • Can then figure out what the environmental impact of that entity’s consumption is • Split up into 4 groups
What information do I need? • Type of nearby generators • Power plants, dams, windmills, solar arrays • Proportion – amount of total generation made up by each type • 40% type A, 30% type B, 30% type C
Regions: NW, NE, SE, SW Generation Types: Coal Natural Gas Petroleum Nuclear Hydroelectric Solar Wind Geothermal Biomass Other
Is that the whole story? • What if power plants near me don’t generate enough electricity to meet my needs? • Pennsylvania does, but what about California and New York? • Include interstate trading • These numbers have a significant impact, so new generation mixes, which include trading, are created for each state
CA: Where Does the Electricity Come From? 1.1 11.8 -3.3 -11.9 29.1 4.8 10.2 -3.1 -69.1 20.1 12.3 2000 Net Imports (TWh)
24.8 4.8 10.2 20.1 2.1 9.2 California imports from other states
Electricity wrap-up • Most power generated by burning fossil fuels • The problem is not that we will run out! • Burning these things likely produces unwelcome effects on a planet-wide level • % of electrification good proxy of level of development and quality of life • 25% of the world is not electrified (~1.6 billion people)
Air Standard pollutants Hg, Se, Cd Water Acid mine drainage Water system disruption Fishing Waste Spent batteries and cells Spent nuclear fuel Safety issues Rail Pipelines Turbines Aesthetics Wind turbines Steam Transmission lines Smog Other social costs? • Externality: “Costs that society must pay which are not borne by the producers”
In green design, we try to find ways to generate the positives associated with electricity without the negatives • Advanced nuclear • Carbon sequestration • Combined heat & power • Large scale renewables • Distributed generation • 3 things you can do to help: • Conservation • every unit of output you save means 3 units of input saved • Conservation • pay attention to things around you which consume power • Conservation • make power consumption a factor in deciding which things you purchase