2/27/03 Outline
260 likes | 450 Vues
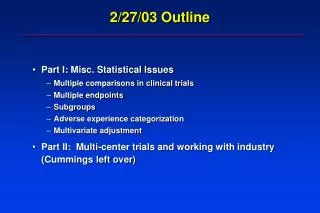
2/27/03 Outline. Part I: Misc. Statistical Issues Multiple comparisons in clinical trials Multiple endpoints Subgroups Adverse experience categorization Multivariate adjustment Part II: Multi-center trials and working with industry (Cummings left over). Multiple comparisons.

2/27/03 Outline
E N D
Presentation Transcript
2/27/03 Outline • Part I: Misc. Statistical Issues • Multiple comparisons in clinical trials • Multiple endpoints • Subgroups • Adverse experience categorization • Multivariate adjustment • Part II: Multi-center trials and working with industry (Cummings left over)
Multiple comparisons • The general problem • Each statistical test has a 5% chance of Type I error • We are wrong 1 time out of 20 • Easy to come up with spurious results • Take a worthless drug (placebo 2) compare to placebo 1 • 1 study: P(type I error)= 5% • 2 studies: P(1 or 2 type I errors)= almost 10% • 20 studies: P(at least one significant)=64% • Publication bias
Multiple comparisons: solutions? • Bonferroni • Divide overall p-value by number of tests • Unacceptable losses of power • Use common sense/Bayesian • Does result make sense? • Biologic plausibility • Is result supported by previous data? • Was analysis defined apriori? • Examples of problem in clinical trials
Multiple comparisons in RCT’s are pervasive • Monitoring of trials: look at results as they accumulate • Lots of statistical machinery • Multiple endpoints in a trial • Primary endpoint: “all fractures” but also found significant reductions in hip fractures • Primary endpoint: fractures, significant reductions in breast cancer • Safety • Subgroup analyses • Multivariate analysis (adjustment) for BL covariates
No Adjustment for Multiple Comparisons? • Rothman, 1990 • Adjustments for multiple comparisons lead to type II errors • A policy of not making adjustments is preferable • “ Scientists should not be so reluctant to explore leads that may turn out to be wrong that they penalize themselves for missing possibly important findings”
Multiple Endpoints: Making a Mountain Out of a Molehill • Multiple Outcomes of Raloxifene Evaluation (MORE) trial • Main outcome: vertebral fractures • Secondary outcome: non-vertebral fractures • Main osteoporotic subtypes: hip, wrist • Overall, no effect of raloxifene on NV fractures • Looked at 14 subtypes of fractures • One significant: ankle. Wanted to title paper: “Raloxifene reduces ankle fractures”
Multiple Endpoints in PEPI: Strict Bonferonni Rule • Post-menopausal Estrogen/Progesterone Intervention PEPI (website) • 4 treatment groups, several primary outcomes: all continuous • Adjust all p-values to account for multiple comparisons • Multiple primary endpoints (4) • Within each endpoint, adjust for 4 treatments
Multiple endpoints • Often many ways to slice the outcome pie • Different subgroups of endpoints • Fractures: all, leg, arm, rib, etc. (MORE) • Multiple comparisons problems • Some solutions • Very explicit predefinition of endpoints • Limit number of endpoints • FDA: single endpoint only
Subgroups • After primary analysis, want to look at subgroups • Does effectiveness vary by subgroup • If drug effective, is it more effective in some populations? • If results overall show no effect, does drug work in subgroup of participants? • Are adverse effects concentrated in some subgroups?
Example: Efficacy of alendronate • FIT II: Women with BMD T-score < -1.6 (osteopenic--only 1/3 osteoporotic) • Women without existing vertebral fractures (2) • Overall results: 14% reduction, p=.07 • Wimpy
RR for clinical fracture of alendronate(FIT II, Cummings, JAMA 1999) 1.5 P=0.07 0.86 (0.73 - 1.01) 1 B Relative Risk B B 0 Overall
RR for clinical fracture of alendronate by baseline BMD groups 1.14 (0.82 - 1.60) 1.03 B 1.5 (0.77 - 1.39) B 0.86 (0.73 - 1.01) B B 1 B Relative Risk B B B B B B B 0.64 (0.50 - 0.82) 0 Overall T < -2.5 T > -2.0 -2.5 < T < -2.0 Baseline Femoral Neck BMD, by T-score
What to Do With an Unexpected Subgroup Finding • Is this a real finding? (not really specified apriori) • Has this been previously observed? • Increase prior probability • Ways to verify • Examine for other similar subgrouping variables (BMD at hip, spine, radius) • Examine for other similar endpoints (hip fractures, etc.) • Most important: look at other trials, if possible and available • Examine biologic plausibility
Effect of alendronate on hip fx depends on baseline hip BMD Baseline BMD T-score -1.6 – -2.5 1.84 (0.7, 5.4) 0.44 (0.18, 0.97) < - 2.5 Overall 0.79 (0.43, 1.44) 0.1 1 10 Relative Hazard (± 95% CI)
Fosamax International Trial (FOSIT) • 1908 women, 34 countries • Lumbar spine BMD T-score < -2 • Alendronate (10 mg) vs. placebo • One year follow-up • BMD main endpoint • 47% reduction in all clinical fractures (p<.05)
FOSIT: Relative risk alendronate vs. placebo within BMD subgroups Baseline hip BMD T NRR* 95% CI Overall 1908 0.53 (0.3,0.9) > -2 955 1.2 (0.5, 2.9) -2 to –2..5 279 0.32 (0.07,1.5) < -2.5 674 0.26 (0.1,0.7)
Subgroup analysis in HERS • Overall no effect of HRT or perhaps harm in year 1 • Is there a subgroup who benefit? • Is there subgroup with significant harm? • Look at relative hazard (RH) within subgroups defined by baseline variables • Medication use at baseline • Prior disease • Health habits • Compare RH in those with and without risk factor • RH in those using beta blockers compared to those not using • RH > 1 ==> harm • Get p-value for significance of difference of RH in those w and without
HERS: 4 years of HRT increased then decreased CHD Events Year E + P Placebo RH p-value 1 57 38 1.5 .04 2 47 48 1.0 1.0 3 35 41 0.9 .6 4 + 5 33 49 0.7 .07 > 5 ??? P for trend = 0.009
Subgroups: the final frontier in HERS Relative hazard (E vs. placebo) Subgroup Within Among Subgroup N (%) Subgroup Others p* history of smoking 1712 (62) 1.01 3.39 .01 current smoker 360 (13) 0.55 1.92 .03 digitalis use 275 (10) 4.98 1.26 .04 >= 3 live births 1616 (58) 1.09 2.72 .04 lives alone 775 (28) 2.97 1.14 .05 prior mi by chart review 1409 (51) 2.14 0.93 .05 beta-blocker use 899 (33) 2.89 1.15 .06 age >= 70 at randomization 1019 (37) 2.65 1.14 .06 * Statistical significance of interaction
Lots of subgroups were analyzed in HERS • history of smoking (at rv) 1712 (62) 1.01 3.39 0.30 .01 • current smoker (at rv) 360 (13) 0.55 1.92 0.29 .03 • digitalis use (at rv) 275 (10) 4.98 1.26 3.96 .04 • >= 3 live births 1616 (58) 1.09 2.72 0.40 .04 • lives alone (at rv) 775 (28) 2.97 1.14 2.60 .05 • prior mi by chart review (cr) 1409 (51) 2.14 0.93 2.30 .05 • beta-blocker use (at rv) 899 (33) 2.89 1.15 2.51 .06 • age >= 70 at randomization 1019 (37) 2.65 1.14 2.32 .06 • prior mi in most distant tertile 447 (16) 2.64 0.93 2.82 .07 • walk 10m or in exercise program (at rv) 1770 (64) 2.35 1.11 2.12 .08 • prior ptca by chart review (cr) 1189 (43) 0.92 1.98 0.46 .08 • prior mi within 2 years 420 (15) 3.20 1.28 2.50 .11 • tg > median (at rv) 1377 (50) 2.02 1.05 1.93 .12 • rales in the lungs (at rv) 80 ( 3) 0.43 1.65 0.26 .13 • digitalis or ace-inhibitor use (at rv) 653 (24) 2.33 1.24 1.88 .16 • previous ert for >= 12 months 302 (11) 4.19 1.41 2.98 .18 • serious medical conditions 1028 (37) 1.05 1.81 0.58 .21 • age >= 53 at lmp 578 (21) 3.19 1.38 2.31 .23 • hdl > median (at rv) 1315 (48) 1.18 1.95 0.61 .24 • lp(a) > median (at rv) 1378 (50) 1.26 2.08 0.60 .25 • use of non-statin llm (at rv) 420 (15) 0.89 1.69 0.52 .25 • married (at rv) 1588 (57) 1.26 1.98 0.64 .29 • lvef <= 40% 178 ( 6) 2.16 1.01 2.13 .31 • prior mi within 4 years 765 (28) 2.07 1.32 1.57 .32 • previous ert use for >= 1 year 327 (12) 2.86 1.41 2.03 .32 • prior mi within 1 year 194 ( 7) 2.88 1.43 2.02 .33 • chest pain (at rv) 982 (36) 1.25 1.88 0.67 .33 • dbp >= 90 mmhg (at rv) 149 ( 5) 0.91 1.62 0.56 .35 • prior ptca within 1 year 206 ( 7) 3.94 1.46 2.71 .38 • prior mi within 3 years 612 (22) 2.05 1.37 1.50 .40 • prior ptca within 4 years 838 (30) 1.15 1.70 0.68 .40 • use of any llm (at rv) 1296 (47) 1.23 1.76 0.70 .40 • diuretic use (at rv) 775 (28) 1.89 1.33 1.42 .41 • signs and symptoms of chf (at rv) 118 ( 4) 0.94 1.60 0.58 .42 • ace inhibitor use (at rv) 483 (17) 2.05 1.40 1.46 .44 • total cholesterol > median (at rv) 1377 (50) 1.32 1.80 0.74 .47 • l-thyroxine use (at rv) 414 (15) 2.29 1.43 1.60 .47 • poor/fair self-rated health (at rv) 665 (24) 1.30 1.72 0.76 .51 • heart murmur (at rv) 540 (20) 1.89 1.42 1.34 .53 • sbp >= 140 mmhg (at rv) 1051 (38) 1.37 1.72 0.80 .59 • prior ptca within 3 years 695 (25) 1.27 1.61 0.78 .62 • s3 heart sounds (at rv) 19 ( 1) 2.74 1.50 1.82 .63 • htn by physical exam (at rv) 557 (20) 1.32 1.62 0.81 .64 • >= 2 severely obstructed main vessels 1312 (47) 1.53 1.26 1.22 .69 • statin use (at rv) 1004 (36) 1.34 1.59 0.84 .71 • have you ever been pregnant 2564 (93) 1.55 1.15 1.35 .72 • calcium-channel blocker (at rv) 1511 (55) 1.61 1.38 1.17 .73 • previous hrt for >= least 12 months 132 ( 5) 1.24 1.60 0.78 .77 • ldl > median (at rv) 1373 (50) 1.44 1.63 0.89 .77 • prior ptca within 2 years 475 (17) 1.35 1.56 0.87 .81 • baseline left bundle branch block 212 ( 8) 1.31 1.55 0.85 .82 • white 2451 (89) 1.48 1.62 0.92 .88 • ever told you had diabetes 634 (23) 1.48 1.53 0.97 .94 • aspirin use (at rv) 2183 (79) 1.51 1.56 0.97 .95 • any alcohol consumption (at rv) 1081 (39) 1.54 1.57 0.98 .97 • gallstones or gallbladder dis. 633 (23) 1.55 1.52 1.02 .97 • baseline atrial fibrillation/flutter 33 ( 1) - 1.50 - - Total subgroups examined: 102 Total subgroups with p< .05: 6
Subgroups: conclusions • Subgroups are full of statistical problems • Multiple comparisons may lead to erroneous conclusions • Limited power in for subgroup analyses • Subgroups based on baseline variables are less bad • Subgroups based on post-randomization variables are more problematic
Safety assessment • Often many categories (FIT: 200 or more) • Some are rare • Ex: Risedronate and lung cancer • How to control for spurious findings? • P-values almost meaningless
Categorization of Adverse Experiences • AE’s collected as “open text” • Need to categorize and compare by treatment • Options: • Many categories: few events per treatment, low power • Few categories: heterogenuous, may miss important effects • No correct solution • MeDRA coding • ~15,000 standard clinical terms (“specific terms”) • Various levels of grouping • May be non-sensical in some situations
Multivariable adjustment • Sometimes adjust for baseline variables • Especially those that are maldistributed • If algorithm for adjustment not pre-defined, adds subjective element to “objective” RCT • Given ineffective treatment, with enough fiddling with adjustments, can come up with significant effect (Paul Meier) • Conclusions: Many argue that should NEVER do adjustments in RCT’s • If do adjustment, severely limit plans
Statistical issues: Summary • ITT (from 1/30 lecture): • All participants remain on medication • All participants are followed until end of study • Pre-planned analysis • Multiple comparisons are ubiquitous • Monitoring • Subgroup analyses • Safety analyses • Where possible, minimize subjectivity and adhoc-ness • Use judgement