Download
1 / 68
700 likes | 929 Vues
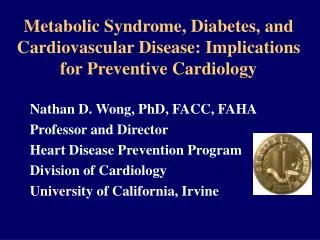
Cardiovascular Disease and the Patient with Diabetes and Metabolic Syndrome Nathan D. Wong, PhD, FACC, FAHA Professor and Director Heart Disease Prevention Program Division of Cardiology University of California, Irvine President, American Society for Preventive Cardiology.

E N D
Cardiovascular Disease and the Patient with Diabetes and Metabolic Syndrome Nathan D. Wong, PhD, FACC, FAHA Professor and Director Heart Disease Prevention Program Division of Cardiology University of California, Irvine President, American Society for Preventive Cardiology
Presenter Disclosure • Dr. Wong has received research support through Bristol-Myers Squibb, Novartis, and Forest Laboratories through the University of California, Irvine
Presentation Objectives • Review the epidemiology implicating metabolic syndrome and diabetes in cardiovascular risk • Discuss the clinical trial evidence for the role of lifestyle management, glycemic, lipid, and blood pressure control. • Address the ABCs of lifestyle and clinical management of metabolic syndrome and diabetes aimed to reduce cardiovascular disease risk.
Diagnosed Diabetes in the US: 2008 4 – 6% 6 – 8% 8 – 10% 10 – 12% CDC BRFSS: Self-Reported Diabetes: 8.2% Nationwide http://apps.nccd.cdc.gov/brfss/list.asp?cat=DB&yr=2008&qkey=1363&state=All
Prevalence of physician-diagnosed diabetes in Adults age 20 and older by race/ethnicity and sex (NHANES: 2005-2006). Source: NCHS and NHLBI. NH – non-Hispanic.
The Continuum of CV Risk in Type 2 Diabetes Adapted from American Diabetes Association. Diabetes Care. 2003;26:3160-3167. Tsao PS, et al. Arterioscler Thromb Vasc Biol. 1998;18:947-953. Hsueh WA, et al. Am J Med. 1998;105(1A):4S-14S. American Diabetes Association. Diabetes Care. 1998;21:310-314.
Diagnostic Criteria for Metabolic Syndrome: Modified NCEP ATP III ≥3 Components Required for Diagnosis AHA/NHLBI Scientific Statement; Circulation 2005; 112:e285-e290.
IDF Criteria: Abdominal Obesity and Waist Circumference Thresholds • AHA/NHLBI criteria: ≥ 102 cm (40 in) in men, ≥ 88 cm (35 in) in women • Some US adults of non-Asian origin with marginal increases should benefit from lifestyle changes. Lower cutpoints (≥ 90 cm in men and ≥ 80 cm in women) for Asian Americans Alberti KGMM et al. Lancet 2005;366:1059-1062. | Grundy SM et al. Circulation 2005;112:2735-2752.
45 Men 40 Women 35 30 25 Prevalence (%) 20 15 10 5 0 20-29 30-39 40-49 50-59 60-69 > 70 Prevalence of the Metabolic Syndrome Among US Adults NHANES 1988-1994 Age (years) Ford E et al. JAMA. 2002(287):356. 1999-2002 Prevalence by IDF vs. NCEP Definitions (Ford ES, Diabetes Care 2005; 28: 2745-9) (unadjusted, age 20+) NCEP : 33.7% in men and 35.4% in women IDF: 39.9% in men and 38.1% in women
Diabetes and CVD • Atherosclerotic complications responsible for • 80% of mortality among patients with diabetes • 75% of cases due to coronary artery disease (CAD) • Results in >75% of all hospitalizations for diabetic complications • 50% of patients with type 2 diabetes have preexisting CAD. (This number may be less now that more younger people are diagnosed with diabetes.) • 1/3 of patients presenting with myocardial infarction have undiagnosed diabetes mellitus Lewis GF. Can J Cardiol. 1995;11(suppl C):24C-28C Norhammar A, et.al. Lancet 2002;359;2140-2144
Risk of Cardiovascular Events in Patients withDiabetes: Framingham Study _________________________________________________________________ _________________________________________________________________ Age-adjusted Biennial Rate Age-adjusted Per 1000Risk Ratio Cardiovascular EventMen WomenMen Women Coronary Disease 39 21 1.5** 2.2*** Stroke 15 6 2.9*** 2.6*** Peripheral Artery Dis. 18 18 3.4*** 6.4*** Cardiac Failure 23 21 4.4*** 7.8*** All CVD Events 76 65 2.2*** 3.7*** Subjects 35-64 36-year Follow-up **P<.001,***P<.0001
Diabetes as a CHD Risk Equivalent: Type 2 DM and CHD 7-Year Incidence of Fatal/Nonfatal MI (East West Study) P<0.001 P<0.001 45.0% 7-year incidence rate of MI 20.2% 18.8% 3.5% No Diabetes Diabetes CHD=coronary heart disease; MI=myocardial infarction; DM=diabetes mellitus Haffner SM et al. N Engl J Med. 1998;339:229-234.
Cardiovascular Disease (CVD) and Total Mortality: U.S. Men and Women Ages 30-74 (Risk-factor adjusted Cox regression) NHANES II Follow-Up (n=6255) *** *** *** *** *** *** *** *** *** *** * ** * p<.05, ** p<.01, **** p<.0001 compared to none Malik and Wong, et al., Circulation 2004; 110: 1245-1250.
Odds of CVD Stratified by CRP Levels in U.S. Persons (Malik and Wong et al., Diabetes Care 2005; 28: 690-3) *** Odds Rat io *** * * ** • *p<.05, **p<.01, **** p<.0001 compared to no disease, low CRP • CRP categories: >3 mg/l (High) and <3 mg/L (Low) • age, gender, and risk-factor adjusted logistic regression (n=6497)
Example of Significant Coronary Calcification from Multidetector CT (Siemens Sensation 64) scanner
10-Year CHD Event Rates (per 1000 person years) by Calcium Score by CAC Categories in Subjects with Neither MetS nor DM, MetS only, or DM Coronary Heart Disease CHD events per 1000 person years Diabetes MetS Neither MetS/DM 0 1-99 100-399 400+ Coronary Artery Calcium Score Malik and Wong et al. (AHA 2009)
Under-Treatment of Cardiovascular Risk Factors Among U.S. Adults with Diabetes • NHANES Survey 2001-2002, 532 (projected to 15.2 million) or 7.3% of adults aged >/=18 years had diabetes • 50.2% not at HbA1c goal <7% • 64.6% not at LDL-C goal <100 mg/dl • 52.3% not at recommended HDL-C >/=40 (M), >/=50 (F) • 48.6% not at recommended triglycerides <150 mg/dl • 53% not at BP goal of <130/80 mg/dl • Overall, only 5% of men and 12% of women at goal for HbA1c, BP, and LDL-C simultaneously Malik S, Wong ND et al. Diab Res Clin Pract 2007;77:126-33.
A1c TargetAspirin Therapy A1c Target: In persons with diabetes, glucose lowering to achieve normal to near normal plasma glucose, as defined by the HbA1c<7% Aspirin Daily: Patients with type 2 DM >40 years of age or with prevalent CVD, OR those with metabolic syndrome without DM who are at intermediate or higher risk (e.g., >=10% 10-year risk of CHD)
Type 2 Diabetes: A1C Predicts CHD CHD Mortality Incidence (%) in 3.5 Years All CHD Events Incidence (%) in 3.5 Years * 12 25 ** 10 20 8 15 6 10 4 5 2 0 0 Low<6% Middle 6-7.9% High >7.9% Low<6% Middle 6-7.9% High >7.9% A1C=hemoglobin A1C *P<0.01 vs lowest tertile **P<0.05 vs lowest tertile Adapted with permission from Kuusisto J et al. Diabetes. 1994;43:960-967.
UKPDS Relative Risk Reduction for Intensive vs. Less Intensive Glucose Control P=0.03 P=0.05 P=0.02 P<0.01 % relative risk reduction P<0.01 Over 10 years, HbA1c was 7.0% (6.2-8.2) in the intensive group (n=2,729) compared with 7.9% (6.9-8.8) in the conventional group (n=1,138). UKPDS Group. Lancet. 1998;352:837-853.
UKPDS Metformin Sub-Study: CHD Events Myocardial Infarction Coronary Deaths 20 10 p=0.01 p=0.02 NS 8 39% Reduction 15 50% Reduction 6 Incidence per 1000 patient years Incidence per 1000 patient years 10 4 5 2 0 0 Insulin SU’s Conventional Diet Conventional Diet Metformin Metformin n= 411 951 342 411 342 #Events 73 139 39 36 16 UKPDS 34, Lancet 352: 854, 1998
Recent Trials Show No Reduction in CV Events with More Intensive Glycemic Control 25 20 15 10 5 0 Intensive therapy Intensive therapy Standard therapy Standard therapy 0 1 2 3 4 5 6 Years 25 20 15 10 5 0 ACCORD: Primary Outcome ADVANCE: Primary Outcome Patients with events (%) Cumulative incidence (%) 0 12 24 36 48 60 Months of follow-up Number at Risk Intensive 5128 4843 4390 2839 1337 475 448 Standard 5123 4827 4262 2702 1186 440 395 Number at Risk Intensive 5570 5369 5100 4867 4599 1883 Standard 5569 5342 5065 4808 4545 1921 1ACCORD Study Group. N Engl J Med. 2008;358:2545-2559. 2ADVANCE Collaborative Group. N Engl J Med. 2008;358:2560-2572.
Was Intensive Glycemic Control Harmful? A closer look at ACCORD AND ADVANCE • ACCORD was discontinued early due to increased total and CVD mortality in the intensive arm. Major hypoglycemia 3-fold higher too. • And the VA Diabetes Trial did show severe hypoglycemia to be a powerful predictor of CVD events. • But a more recent analysis of ACCORD just published (Diabetes Care, May 2010) showed deaths to be associated with unsuccessful intensive therapy where A1c remained high. • However, in both ACCORD AND ADVANCE, the subgroups without macrovascular disease at baseline had an actual benefit in the primary endpoint.
2009 ADA/AHA/ACC Statement Recommendations Goal of A1c<7% remains reasonable for uncomplicated patients ACC/AHA Class I (A) and for those with macrovascular disease ADA Level B; ACC/AHA Class IIb (A) Incremental microvascular benefit may be obtained from even lower goals ADA Level B; ACC/AHA Class IIa (C) Less stringent goals may be appropriate for those with labile glucose control or with advanced micro- or macrovascular disease ADA Level C; ACC/AHA Class IIa (C) Circulation 2009; 119: 351-357
Prevalence of Hypertension* in Adults with Diabetes: NHANES III 1988-1994 % with Hypertension *BP ≥130/85 or therapy for hypertension Geiss LS, et al. Am J Prev Med. 2002;22:42-48.
HTN Control Rate Remains Poor in US Adults with MetS and DM from NHANES 2003-2004(Wong ND et al., Arch Intern Med 2007) • Only 35% of those with DM on treatment for HTN are controlled to a goal of <130/80 mmHg • Only 47% of those with MetS on treatment for HTN have a blood pressure of <130/85 mmHg • Thus, JNC-7 recommendations to begin with combination therapy to improve goal attainment should be adhered to, esp. if SBP/DBP exceeds 20/10 mmHg from goal.
UKPDS: Effects of Tight vs. Less-Tight Blood Pressure Control UK Prospective Diabetes Study Group. BMJ. 1998; 317:703-713.
HOT Trial: Effect of BP Control on CV Event Rate Patients without Diabetes Patients with Diabetes Major CV events per 1000 patient-years Diastolic Blood Pressure goal Hansson L et al. Lancet. 1998;351:1755-1762.
ACCORD: Effects of Intensive BP Control (NEJM 2010: 362: 1575-85) • 4733 participants with type 2 DM randomly assigned to intensive therapy targeting a SBP <120 mmHg vs. standard therapy targeting a SBP<140 mmHg. • Mean follow-up 4.7 years. • SBP after 1 year was 119 vs. 133 mmHg. • No difference in the primary endpoint of nonfatal MI, stroke, or CVD death (annual rate): 1.9% vs. 2.1% (HR=0.88), p=0.20. • Stroke annual rates significantly lower 0.32% vs. 0.53%, HR=0.59, p=0.01. Thus, overall benefit may be greater in populations with higher stroke risk.
Scientific Statements: Diabetes, CV Disease and Hypertension JNC VII Report on Diabetic Hypertension BP goal (<130/80 mm Hg) Commonly requiring combinations of ≥2 drugs ACEIs, CCBs, Thiazide-diuretics, -blockers, and ARBs shown to reduce CVD/CVA risk ACEIs/ARBs reduce progression of diabetic nephropathy and reduce albuminuria ARBS reduce progression of macroalbuminuria Grundy SM, et al. Circulation. 1999;100:1134-1146. Chobanian AV, et al. JAMA. 2003;289:2560-2572.
LDL-C as a Predictor of CAD in Patients with Diabetes Hazard ratio LDL-C quartile mean LDL=low-density lipoprotein cholesterol; CAD=coronary artery disease. Adapted with permission from Howard BV et al. Arterioscler Thromb Vasc Biol. 2000;20:830-835.
CARDS: Primary Endpoint Relative Risk Reduction 37% (95% CI: 17-52) 15 P = 0.001 Placebo 127 events 10 Cumulative Hazard (%) Atorvastatin 83 events 5 0 0 1 2 3 4 4.75 Years Placebo 1351 1306 1022 651 1410 305 Atorva 1428 1392 1361 1074 694 328 Colhoun HM et al. Lancet 2004;364:685-96.
HPS Substudy: First Major Vascular Event by LDL-C and Prior Diabetes Status LDL-C anddiabetes status Simvastatin(10,269) Placebo(10,267) Rate ratio (95% CI) Statin better Placebo better <116 mg/dL With diabetes 191 (15.7%) 252 (20.9%) No diabetes 407 (18.8%) 504 (22.9%) ³116 mg/dL With diabetes 410 (23.3%) 496 (27.9%) No diabetes 1,025 (20.0%) 1,333 (26.2%) 24% reduction(P<0.0001) All patients 2,033 (19.8%) 2,585 (25.2%) 0.4 0.6 0.8 1.0 1.2 1.4 HPS Collaborative Group. Lancet. 2003;361:2005-2016.
Reducing CVD Risk with Statin Therapy in Patients with Diabetes Number needed to treat to prevent 1 major CVD event From HPS and 4S Without coronary disease 14 With coronary disease 4 From meta-analysis Without vascular disease 39 With vascular disease 19 HPS Collaborative Group. Lancet. 2003;361:2005-2016. Pyorala K, et al. Diabetes Care. 1997;20:614-620 Kearney PM Lancet;2008:371:227-239
Lipid Goals for Persons with Metabolic Syndrome and DM (Grundy et al., 2005) LDL-C targets, ATP III guidelines –High Risk: CHD, CHD risk equivalents (incl. DM or >20% 10-year risk): <100 mg/dL (option <70 mg/dl if CVD present) – Moderately High Risk (10-20%) 2 RF: <130 mg/dL, option <100 mg/dL – Moderate Risk (2+ RF, <10%) <130 mg/dL -- Low Risk: 0-1 RF: <160 mg/dL HDL-C: >40 mg/dL (men) >50 mg/dL (women) TG: <150 mg/dL
Non-HDL: Secondary Target Non-HDL = TC – HDL Non-HDL: secondary target of therapy when serum triglycerides are 200 mg/dL (esp. 200-499 mg/dl) Non-HDL goal: LDL goal + 30 mg/dL Specific Dyslipidemias: Elevated Triglycerides
Management of Low HDL LDL is primary target of therapy Weight reduction and increased physical activity (if the metabolic syndrome is present) Non-HDL is secondary target of therapy (if triglycerides 200 mg/dL) Consider nicotinic acid or fibrates (for patients with CHD or CHD risk equivalents) Specific Dyslipidemias: Low HDL Cholesterol
ACCORD Lipid Study Results (NEJM 2010; 362: 1563-74) • 5518 patients with type 2 DM treated with open label simvastatin randomly assigned to fenofibrate or placebo and followed for 4.7 years. • Annual rate of primary outcome of nonfatal MI, stroke or CVD death 2.2% in fenofibrate group vs. 1.6% in placebo group (HR=0.91, p=0.33). • Pre-specified subgroup analyses showed possible benefit in men vs. women and those with high triglycerides and low HDL-C. • Results support statin therapy alone to reduce CVD risk in high risk type 2 DM patients.
Smoking Cessation • What you do does matter. Physicians who intervene influence cigarette smoking behavior. • How do you get your patients to quit smoking? • Identify i.e.: in vitals signs • Interventions as brief as 3 minutes can significantly increase quit rates • Dose dependent changes in behavior • 5-10% may quit within 1 year with MD advice alone • Smoking cessation aids
EFFICACY OF SMOKING CESSATION INTERVENTIONS (1 YEAR QUIT RATES) ACUPUNCTURE ---- HYPNOSIS ---- PHYSICIAN ADVICE 6% SELF-HELP METHODS 14% NICOTINE PATCH 11-15% PHYSICIAN ADVICE/SELF-HELP PAMPHLETS 22% AVERSIVE SMOKING (RAPID PUFFING) 25% PHARMACOTHERAPY/BEHAVIORAL THERAPY 25% BEHAVIORAL STRATEGIES (GROUP PROG.) 40%
The 5 “A’s” for Effective Smoking Intervention • ASK about smoking • ADVISE to quit • ASSESS willingness to make a quit attempt • ASSIST if ready - offer therapy and consultation for quit plan and if not, then offer help when ready • ARRANGE follow up visits
CHD Mortality Rates(by Degree of Glucose Tolerance) Incidence rate/1000 *Indicates patients known to have diabetes prior to the study. CHD=coronary heart disease; NGT=normal glucose tolerance; IGT=impaired glucose tolerance Adapted with permission from Eschwege E et al. Horm Metab Res Suppl. 1985;15:41-46.
Most Cardiovascular Patients Have Abnormal Glucose Metabolism GAMI n = 164 EHS n = 1920 CHS n = 2263 18% 27% 31% 35% 37% 37% 36% 45% 34% Prediabetes Type 2 Diabetes Normoglycemia GAMI = Glucose Tolerance in Patients with Acute Myocardial Infarction study; EHS = Euro Heart Survey; CHS = China Heart Survey Anselmino M, et al. Rev Cardiovasc Med. 2008;9:29-38.