Download
1 / 20
210 likes | 323 Vues
Orbital Control of Climate. The last 600,000 years. Objective. To understand orbital control of natural climate change during the Quaternary (late Tertiary), the last 2.5My. 2.5My-0.65My (weak ice ages, every 50Ky), 0.65My-present (strong ice ages, every 100Ky). Broecker, p.167.

E N D
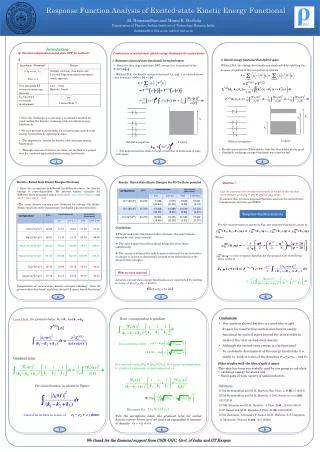
Orbital Control of Climate The last 600,000 years
Objective To understand orbital control of natural climate change during the Quaternary (late Tertiary), the last 2.5My
2.5My-0.65My (weak ice ages, every 50Ky), 0.65My-present (strong ice ages, every 100Ky) Broecker, p.167
The last 600ky… LGM Last Glacial Maximum 18Ky
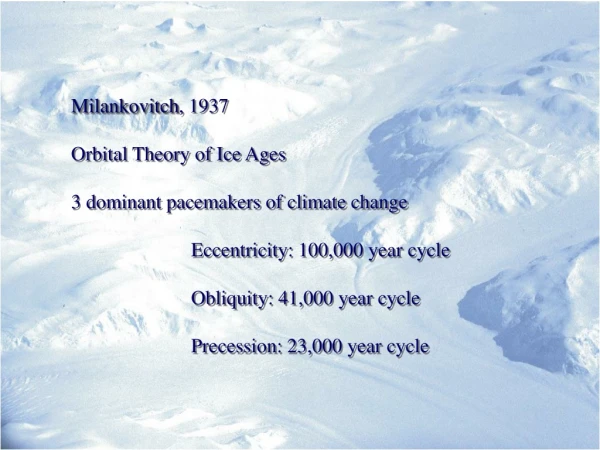
Orbital Cycle Changes • 1• Shape of Earth’s yearly path of revolution around the Sun • ECCENTRICITY • 2• Tilt of Earth’s axis • TILT • 3• Changing positions of the seasons along that path • PRECESSION Various records of climate (ice cores, deep ocean circulation, greenhouse gas concentrations, cyclic stratigraphy in sediments) have these same orbital cycles.
1. Eccentricity • 3% range of variation of E-S distance due to elliptical orbit around Sun, Pull of large planets • Now, perihelion occurs during northern Winter (3 January) • 100ky and 413ky periods • Now, e =.0167 (relatively circular)
2. Tilt - Reason for Seasons • Now tilt is 23.5°, and is decreasing. • Higher the tilt, higher the seasonal differences • Has gone from 24.5° -22.2°, varied by pull of large planets • 41 ky period
3. Precession - WobbleVaries E-S distance with season • Variation of the direction in which the E axis leans. • Caused by the pull of Sun and moon on Earth • Now Earth’s axis points to Polaris • 23 ky stronger period - combined wobble and slow turning of elliptical orbit. Now 11Kya
On the long term…the precessional index Eccentricity variations at 100Ky and 413Ky modulate the amplitude of the precession cycle. This may be why we have the 100Ky ice age cycle
Variation of insolation with time - Big changes at high northern latitudes during deglaciations (arrows, June solstice at perihelion)
How orbital theory, climate records (18O)and northern hemisphere insolation (i.e. melting in N. Atlantic) compare over the past 600ky. now LGM 18ky Cold warm
Figs 10-15 and 10-17 Isotopic and spectral evidence of transition to 100ky ice age periodicity… Raymo, 1994, Ann Rev Ea Planet Sci 22, 353
Milankovitch Theory of ice ages What triggers an ice age? Low insolation: • when tilt is small (~22°)(seasonality differences are smallest) • Eccentricity is large (very elliptical orbit) • Perihelion occurs during the northern hemisphere’s winter Deglaciation can be triggered when: • perihelion occurs in July (e.g. 11K ya) • the Earth’s tilt is near its maximum What are the mechanisms that amplify orbital variations in insolation? (1) Ice-albedo feedback (2) ocean circulation/CO2 feedback (Shackleton 2000) – ice lags CO2 and orbital changes
Crucial for deglaciation melting Relative effects of orbital cycles on insolation at 65°N 20-30W 25-90W 25W Broecker, p.159
Cycle of ice sheet growth - FACTS: Ice accumulation rates (0-.5m/y) << Ablation rates (0-4m/y) Summer insolation is most important for ice sheet growth and decay Fig. 10-12
Cycle of ice sheet growth - What makes ice sheets grow and shrink? P = Climate Point, where equilibrium line intersects surface Equilibrium line = Boundary between areas of net ice ablation and accumulation. Cooling at higher altitudes, 6.5°C cooling per km of alti- tude. = Ice Elevation Feedback accumulation ablation D.* Ice growth continues because Insolation levels are still relatively Low and most of ice is at high elevation
Cycle of ice sheet growth - 3 Factors control ice sheets: Insolation control of IS size Initial lag of vol behind Insolation Subsequent lag of bedrock depression and rebound behind ice loading and unloading. accumulation ablation