Habitat loss and fragmentation II
510 likes | 755 Vues
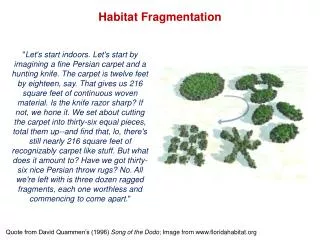
Habitat loss and fragmentation II. Bio 415/615. Questions. 1. What changes in patch structure occur with habitat fragmentation? 2. How is fragmentation measured? 3. Are Eastern U.S. forests more or less fragmented than they were 150 years ago? 4. What does an incidence function measure?

Habitat loss and fragmentation II
E N D
Presentation Transcript
Habitat loss and fragmentation II Bio 415/615
Questions 1. What changes in patch structure occur with habitat fragmentation? 2. How is fragmentation measured? 3. Are Eastern U.S. forests more or less fragmented than they were 150 years ago? 4. What does an incidence function measure? 5. What is remote sensing, and how can it improve deforestation rate measurements?
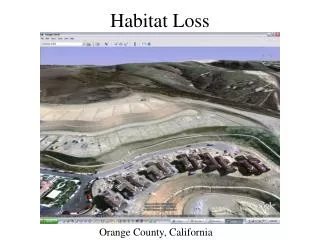
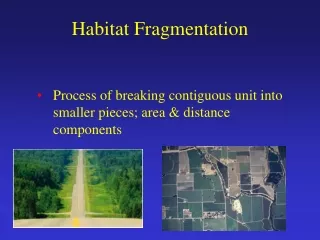
Example of Habitat loss and Fragmentation in a Wisconsin Forest
Brazilian Atlantic Rainforest Cote d’Ivoire Forest
Norway 1900 1940 1998 Wilderness >5 km from human centers
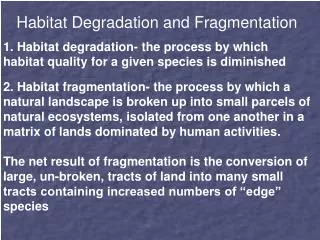
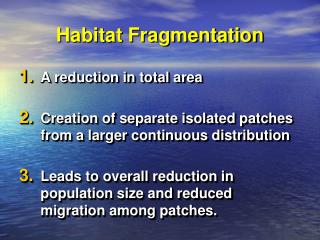
Fragmentation • Total area decreases • Size of patches decreases • Number of patches increases • Isolation increases, connectedness decreases • Edge length increases • But changes in habitat arrangement rarely occurs without habitat LOSS
How is fragmentation measured? • Number of patches • Mean patch size • Probability of adjacency • Average proximity • Connectivity • Shape complexity • Edge length
Understanding fragmentation • Relevance: some habitats and populations are naturally patchy • Age and dynamics over time • Matrix properties • Ecological contrast (human patchiness vs. natural heterogeneity) • Goldilocks principle: specialists and generalists • Local/Regional scaling issues (rescue effect, dispersal limitation) • Edge effect
Current diversity bears the imprint of past fragmentation (Vellend 2003) The extent of past forest loss influences the present richness of forests, even after widespread reforestation… the processes of re-equilibration can take centuries!
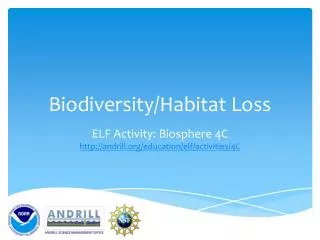
Tropical deforestation • Greatest threat to global biodiversity? • How do we measure deforestation rate? • Reporting by gov’t organizations and NGOs (UN Food & Agriculture Organization, State of the World’s Forests) Biases? • Remote sensing
FAO data: how to interpret? • Grainger 2008 PNAS on FAO Forest Resources Assessments (FRAs): “it is difficult to demonstrate [tropical forest decline] convincingly using… available data” • Large variance in estimates of tropical forest area; FAO tends to be high • From estimates below, do we conclude that tropical forests are actually increasing? NO! • Errors include 1) subjectivity in ‘expert assessments’ 2) reporting is done in different years among countries, so data must be corrected to a standard year 3) forest classes change over time and must be lumped, separated, etc (open forest, savanna, closed canopy, etc)
Remote sensing Some areas of Rondonia, Brazil, have been almost completely deforested in just 6 years. This pair of images uses a scale, or index, of vegetation to compare forest area in 2000 to 2006 at the full resolution (15 meters per pixel) of the Advanced Spaceborne Thermal Emission and Reflection Radiometer (ASTER) instrument. Cleared areas (tan) spread from roads cut through the forest (green), a pattern of deforestation typical in Rondonia. (Maps by Robert Simmon, based on ASTER data.) NASA Earth Observatory
NDVI = normalized difference vegetation index NDVI = near-infrared – red near-infrared + red • Chlorophyll absorbs (visible) RED light (and blue light) and scatters near-INFRARED light (>800 nm). • So plants look bright in infrared, but dark in red. The difference between the intensity of these spectral measurements indicates how much chlorophyll is on the ground, and is thus a gross measure of plant density (e.g., leaf area index or LAI).
Estimating tropical deforestation rates:Achard et al. 2002 Science • Closed evergreen forests in humid tropics • Change in cover of several forest type categories between 1990 and 1997 via remote sensing • About 6 million ha lost each year globally; another .7 million ha degraded • BUT this was 23% LESS than the FAO estimate! loss gain Net change
Projecting future deforestation rates:Soares-Filho et al. 2006 Nature • Trends in agricultural expansion in the Amazon basin • Based on current growth trends in cattle ranching and soy production • 40% loss by 2050 • Expansion and enforcement of current protected areas could reduce loss by 1/3 Regions of loss by 2050 Rate of loss by ecoregion
What happens as a result of fragmentation? • Island biogeography: • Genetics: • Populations: • Metapopulations: • Communities:
What happens as a result of fragmentation? • Island biogeography: extinction increases, immigration decreases (paleorefuges, landbridge islands), extinction debt is paid, nestedness increases • Genetics: effective population size decreases, drift increases, gene flow decreases • Populations: population size decreases, extinction risk increases • Metapopulations: immigration decreases, patch occupancy falls, extinction risk increases • Communities: species interactions change, integrity (area larger enough for key processes like top predators and fire) decreases
What happens to particular species? • Habitat preferences? • Random vs. deterministic changes? • Incidence functions, thresholds? • Area-sensitivity • Isolation-sensitivity
Effects of patch size loss Megareserves for large predators >106 ha 100 km linear extent
Add isolation into incidence function Crooks 2002
Fragmentation’s other side:Edges, Edge Effect, Edge Influence
Avian brood parasitism Brown-headed cowbird
Area Buffer…or just edge effect? Corridors Use? Disease and invaders? Conservation response to fragmentation
Edge influence on forest structure and composition in forested landscapes.Harper et al. 2005. Con. Bio. 19:768-782.
Getting more sophisticated about edges: sun angle and direction
Debinski & Holt 2000Con. Bio. 14:342-355. • 20 studies, worldwide • 6 in forests • 14 in grasslands, old fields • 6 Hypotheses • Spp richness increases with area • Spp abundance, density increases with area • Inter-spp interactions modified • Edge effect influences ecosystem services • Corridors enhance movement • Connectivity increases richness
Debinski & Holt 2000Con. Bio. 14:342-355. • Little consistency • Edge effects, competitive release, spatial scale • Transient effects; some trends evident only in the long-term studies, >=14 yrs; Relaxation times long • Goldilocks problem: species and group differences • Scale differences • Arthropod experiments best fit richness & area • Highly mobile (birds, mammals), early successional plants, long-lived spp, and generalist predators did not respond as expected • Movement, richness correlated with corridors, connectivity
‘natural’ experiment in Venezuela; predators of vertebrates are absent due to fragments being too small
Results • All islands lost jaguar, puma, harpy eagle within 4 years • Smallest islands, <1 ha, lost 75% of their species • Abundance increases for spp able to persist on small islands: 2x (birds), 30x (howler monkeys), 100x (leaf cutter ants) • Trophic effects as in HSS (the world is green): herbivores up on small islands, but some down on medium islands where armadillos occur and escape their own predators • Chance effects: the agoutis trapped on one island converted plant cover to spp whose seeds agoutis like to bury!
Breeding Bird Survey DataDonovan & Flather 2002Ecol. App. 12:364-374.
dasdfa (Numbers are keyed to citations)