Download
1 / 28
280 likes | 369 Vues
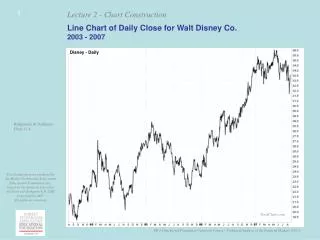
Explore Walt Disney Co.'s stock performance from 2003 to 2007 with a detailed weekly line chart. Track trends and make informed decisions.

E N D
Line Chart of Daily Close for Walt Disney Co.2003 - 2007 Disney - Daily Kirkpatrick & Dahlquist Chart 11.4 StockCharts.com
Line Chart of Weekly Closes for Walt Disney Co.2003 - 2007 Disney - Weekly Kirkpatrick & Dahlquist Chart 11..5 StockCharts.com
Line Chart of Monthly Closes for Walt Disney2003 - 2007 Disney - Monthly Kirkpatrick & Dahlquist Chart 11.6 StockCharts.com
Daily Bar Chart for Krispy Kreme DoughnutsJune 1 - August 22, 2007 Krispy Kreme - Daily Kirkpatrick & Dahlquist Chart 11.7 StockCharts.com
Weekly Bar Chart for Krispy Kreme DoughnutsDecember 1, 2002 - August 22, 2007 Krispy Kreme - Weekly Kirkpatrick & Dahlquist Chart 11.8 StockCharts.com
Monthly Bar Chart for Krispy Kreme DoughnutsJune 1, 2001 - August 22, 2007 Krispy Kreme - Monthly StockCharts.com
Monthly Bar Chart for Cisco Systems, Inc.1995-2005 (arithmetic scale) Cisco - CSCO Kirkpatrick & Dahlquist Chart 11.10 StockCharts.com
Monthly Bar Chart for Cisco Systems, Inc.1995-2005 (logarithmic scale) Cisco - CSCO Kirkpatrick & Dahlquist Chart 11.11 StockCharts.com
Definition of Candle Terms Drawing the Candle Lines
Daily Candlestick Chart for Krispy Kreme DoughnutsJune 1 - August 22, 2007 Krispy Kreme - Daily Kirkpatrick & Dahlquist Chart 11.9 StockCharts.com
Daily Candle Chart for DIA (Diamonds)September 30, 2007 - January 16, 2008 StockCharts.com
Alleghany Technologies, Inc.One point ($1) box and 1 box reversal
Alleghany Technologies, Inc.One point ($1) box and 3 box reversal
Alleghany Technologies, Inc.Two point ($2) box and 1 box reversal
Alleghany Technologies, Inc.Two point ($2) box and 3 box reversal
S&P 500 SPDRs (SPY)1 pt/box; 1 box reversal chart - daily StockCharts.com
S&P 500 SPDRs (SPY)2 pt/box; 1 box reversal chart - daily SPY 2 pt. bare - missing StockCharts.com
S&P 500 SPDRs (SPY)3 pt/box; 1 box reversal chart - daily SPY 3 pt. bare - missing StockCharts.com
S&P 500 SPDRs (SPY)3 pt/box; 1 box reversal chart - daily -- 10-column moving average SPY 3 pt. - 1 ma - missing StockCharts.com
S&P 500 SPDRs (SPY)P&F Pattern: Ascending Triple Top Breakout - Daily3 pts/box, 1 box reversal chart -- 10-column moving average -- 20-column moving average StockCharts.com
S&P 500 SPDRs (SPY)P&F Pattern: Ascending Triple Top Breakout - Daily3 pts/box, 1 box reversal chart -- 10-column moving average -- 20-column moving average -- 50-column moving average StockCharts.com
S&P 500 SPDRs (SPY)P&F Pattern: High Pole Warning2 pts/box; 1 box reversal chart - daily -- 10-column moving average -- 20-column moving average -- 50-column moving average StockCharts.com
S&P 500 SPDRs (SPY)1 pt/box; 1 box reversal chart - daily -- 10-column moving average -- 20-column moving average -- 50-column moving average StockCharts.com
street TRACKS Gold Trust Shares (GLD)1 pt/box, 1 box reversal chart -- 10-column moving average -- 20-column moving average -- 50-column moving average StockCharts.com
street TRACKS Gold Trust Shares (GLD)P&F Pattern: High Pole Warning2 pts/box, 1 box reversal chart -- 10-column moving average -- 20-column moving average -- 50-column moving average StockCharts.com
Citigroup, Inc. (C)P&F Pattern: Quadruple Top BreakoutAverage True Range (120) - 1.24 pts/box, 1 box reversal chart -- 10-column moving average -- 20-column moving average -- 50-column moving average StockCharts.com
United States Oil Fund (USO)Average True Range (120) - 1.68 pts/box, 1 box reversal -- 10-column moving average -- 20-column moving average -- 50-column moving average StockCharts.com StockCharts.com
Goldman Sachs Group, Inc. (GS)P&F Pattern: Ascending Triple Top Breakout - DailyAverage True Range (120) - 5.63 pts/box, 1 box reversal chart Bollinger Bands StockCharts.com