Download
1 / 49
490 likes | 647 Vues
MegaPixel Madness: technologies for ultra-high resolution display systems. Kevin Ponto October 2009. About Myself. Grew up in Iowa City City High 2000 graduate B.S. Computer Engineering (2004) University of Wisconsin - Madison M.S. Arts Computation Engineering (2006)

E N D
MegaPixel Madness: technologies for ultra-high resolution display systems Kevin Ponto October 2009
About Myself • Grew up in Iowa City • City High 2000 graduate • B.S. Computer Engineering (2004) • University of Wisconsin - Madison • M.S. Arts Computation Engineering (2006) • University of California, Irvine • C.Ph. Computer Science Engineering (2009) - University of Californina, San Diego
Projects • Pigeon Blog • Discovering a Lost da Vinci Painting • Locating the Tomb of Genghis Khan • Multi-touch and Mixed Reality Interfaces
Resolution INFORMATION UNIT
Resolution • Can be temporal, spatial, etc • Can also be thought of as measurement of detail • Larger sizes do not necessarily increase resolution • Especially true for display technology http://en.wikipedia.org/wiki/Image_resolution
A Few Common Uses • Print Media • Imaging Technologies • Display Technologies
Print Media • DPI • Physical measure of resolution Dots Inch http://en.wikipedia.org/wiki/Dots_per_inch
Imaging Technologies • Mega-Pixels Millions of Pixels Image 3264 (pixels wide) x 2448 (pixels tall) 7,990,272 (pixels total) = 8 MegaPixels 3264 x 2448
Display Technologies • Standard Vertical Scanlines Display http://en.wikipedia.org/wiki/Television
Display technologies • Vertical Scanlines • Progressive scan / Interlace http://en.wikipedia.org/wiki/HD_TV
HIPerSpace • Highly Interactive Parallelized Display Space http://vis.ucsd.edu/mediawiki/index.php/Research_Projects:_HIPerSpace
HIPerSpace Stats • 70 Dell 30 Inch Monitors • 2,560 x 1,600 = 4,096,000 ( 4 MegaPixels) • Driven by 18 nodes (Dell XPS) • Each node drives 2-4 Monitors (8-16 MegaPixels) • Total Resolution • 35,840 x 8,000 pixels • Total Pixel Count: 286,720,000 • Approximately 300 MegaPixels • 150 times HD
One Pixel Per American http://en.wikipedia.org/wiki/United_States
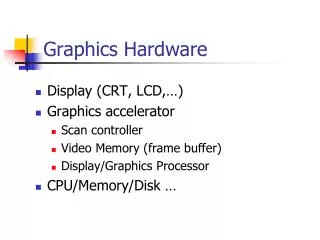
Hardware • Walls can be made in several ways • Projector based • HDTVs • Computer Monitor LCD Screens • Each of these have different advantages and disadvantages • Cost to build and maintain • Size • Seams • Resolution
Projection Walls • Currently the only method to create a bezelless high resolution display wall • Require seam matching • May be easier to create passive and active stereo display spaces • High maintenance cost • Bulbs, power, etc
LCD Walls • generally higher pixel density (DPI) • 20/20 vision is the name of the game • smaller physical footprint • no throw distance issues • no issues with front vs rear-projection • smaller energy footprint • smaller heat signature • no noise emission • better contrast • easy to scale
State of the Art Technologies • New LCD screens have very small bezels • 5 mm bezel (1 cm when stacked side-by-side) http://ucsdnews.ucsd.edu/newsrel/general/09-09KAUST.asp
State of the Art Technologies • Passive Stereo Displays • Use polarization to create 3D effects • Previously done with multiple projectors http://ucsdnews.ucsd.edu/newsrel/general/09-09KAUST.asp
Challenge • How do you efficiently and effectively drive this many pixels? • Three Different Methods • Geometry Broadcast • Pixel Streaming • Distributed Application
Geometry Broadcast • Intercept GL calls and forward them to the display environment
Geometry Broadcast Render Nodes Head Node
Geometry Broadcast • Pros • Little if no recompilation necessary • May “work out of the box” • Can use on programs not designed for tiled display environments • Cons • Slow! • Shaders, textures, etc are problematic • Only really useful for looking at 3D geometry only • Applications • WireGL • Chromium
Pixel Streaming • One node generates fills an image buffer with content • The buffer is split into regions for the viewpoint of each of the render nodes • These data segments are streamed to each of the render nodes.
Pixel Streaming Buffer Render Nodes Head Node
Pixel Streaming • Pros • Only one node needs to render content • Only one node needs access to data, applications etc • Render nodes do not need to be powerful • Multiple applications/streams can be used once • Cons • Only as high resolution as the buffer • Massive network requirements • Applications • SAGE
Distributed Application • Start the same application on all nodes at the same time • Use a different viewpoint for render nodes • Forward all events from head node to render nodes • User I/O • Display Swaps
Distributed Application Head Node Render Nodes
Distributed Application • Pros • Enables almost limitless scalability • Shaders, textures, etc are native • Minimal network • Cons • Requires recompilation / redesign • Guarantee events are received and processed at the same time on every node • Applications • CGLX
CGLX • Distributed master-slave environment • GLUT-like programming environment • Viewpoints are configured on render nodes • I/O reliably forwarded using UDP • Open API • Free to universities
What is this useful for? • Users can now see multimedia at unprecedented detail • Distributed approach allows for interactive manipulation of large amounts of data • Works well in the field of visual analytics
Human Centric Data Analysis • Visual Analytics • “Science of analytical reasoning facilitated by interactive visual interfaces.” (Thomas:2005) • Synergy between human and machine analysis • Synthesize information to detect important features in massive datasets • “Detect the expected and discover the unexpected” (Thomas:2005) • Presenting data in a way such that the human mind is able to efficiently process
Why use the human mind? • Humans have a lifetime of experience in their profession • The human mind is the best general-purpose pattern recognizer compared with AI algorithms. (Moravec:1998) • It only takes the human brain a little over a tenth of a second in order to identify and classify an object in a complicated environment (Riesenhuber:2000) • The human mind can find patterns and differences even when the differences seen in objects are not easily quantifiable • the symbol grounding problem (Harnad:1999).
Visual Analytics: Challenges • Data must be organized and presented in a meaningful way to be effective • Visual Analytics techniques need to be catered to the data being analyzed as well the users of the system • Large image collection needs different visual analytic paradigms compared to the visual analytics for detecting intruders on a network • No “one size fits all” solution
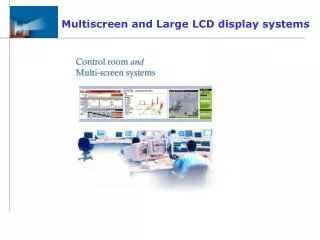
Why use Large Scale Display Walls? • Historically researchers work on a single display • Suboptimal • Large Tiled Display Walls • Allow human body's resources to interact and physically navigate with large displays. (Ball:2007) • Allow multiple users to interact with a work space all at once • The human retina can process approximately ten one-million- point images per second (Moravec:1998) • High resolution displays are more effective than lower resolution with pan and zoom(Ball:2005)
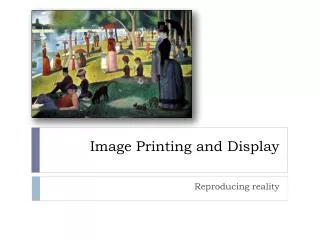
Small Multiples • Use display real-estate to display many variations of similar data • High resolution allows data to be displayed with out sub-sampling • Many users can view the data simultaneously • Users can analyze the data physically
Small Multiples on HIPerSpace • Environment is fully interactive • Can be repositioned and rescaled interactively
Case Study • Researchers at UCI used tiled display wall to show many variations of brain activity of schizophrenia patients • Data was grouped and sorted • Patterns were found • Two patentsresulted fromthe analysis
Diffusion Tensor Imaging • High resolution displays allow us to analyze these type of models in greater detail
Microscopy Imaging • Offer very high resolution images
Conclusion • Ultra-high resolution displays provide new opportunities for human centric computation • Multiple users can analyze data simultaneously • These display environments allow researches to discover the unexpected • Abundant opportunities for new research and collaborations