Download

1 / 64
640 likes | 834 Vues
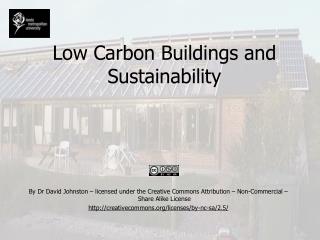
Low Carbon Buildings and Sustainability. By John Bradley & Dr David Johnston – licensed under the Creative Commons Attribution – Non-Commercial – Share Alike License http://creativecommons.org/licenses/by-nc-sa/2.5/. ENVIRONMENTAL SCIENCE & SERVICES LEVEL 1. Energy resources and fuels

E N D
Low Carbon Buildings and Sustainability By John Bradley & Dr David Johnston – licensed under the Creative Commons Attribution – Non-Commercial – Share Alike License http://creativecommons.org/licenses/by-nc-sa/2.5/
ENVIRONMENTAL SCIENCE & SERVICES LEVEL 1 Energy resources and fuels CHP & District Heating John Bradley and Dr David Johnston
Objectives Understand the difference between renewable and non-renewable energy sources Be aware of the energy and CO2 emissions attributable to domestic buildings Define what is meant by a District Heating system and a Combined Heat and Power (CHP) system Identify a number of different types of these systems Be aware of issues which relate to the integration of CHP into buildings Identify the advantages of district heating and CHP Content Energy supply Domestic energy use Low and zero carbon (LZC) energy generation technologies District Heating Objectives and Content
Introduction UK has recently adopted an ambitious 80% reduction target in CO2 emissions by 2050 in an effort to combat climate change (HM Government, 2008). Emissions associated with the domestic sector, primarily from electricity use and heat generation in homes, account for 27% of UK emissions (DEFRA, 2008), and will have to be dramatically reduced, to virtually nothing by 2050 Climate Change Act 2008 Government targets for CO2 emissions to 2050 2050 [Source: DECC, 2009]
Introduction • Studies (ECI, 2005) suggest extensive refurbishment of the existing housing stock and more thermally efficient building fabric in new-build will not be enough to achieve these targets, and that use of low or zero carbon (LZC) energy is essential. This will require a decarbonised electricity grid, and onsite LZC generation of electricity and heat (microgeneration). • Such technologies include: renewable electricity generation from solar photovoltaics or small wind turbines; renewable heat from solar water heating, wood burners and other biomass boilers; and low carbon technologies such as heat pumps and combined heat and power (CHP) generators. District or community heating schemes are one way in which CHP can be used to deliver energy efficiently, and with reduced emissions if using biomass as a fuel. • This lecture looks at the different types of energy resources and the way in which energy is supplied to the domestic sector. It then examines the way energy is used in dwellings, LZC technologies and the contribution they can make to reducing carbon emissions from buildings.
Energy resources There are five ultimate sources of useful energy: 1.The sun 2. The motion and gravitational potential of the sun, moon and earth 3. Geothermal energy from cooling, chemical reactions, and radioactive decay in the earth 4. Nuclear reactions on the earth 5. Chemical reactions from mineral resources These five energy sources can be split into two main categories: • Non-renewable energy - energy obtained from static stores of energy that remain bound unless released by human interaction, e.g., nuclear fuels, fossil fuels - oil, coal, natural gas. • Renewable energy - energy obtained from the continuing or repetitive currents of energy occurring in the natural environment, e.g., solar, wind, tidal, biomass, geothermal.
Fossil fuels: Carbon intensities The majority of the electricity and heat that we use comes from fossil fuels. Burning these fuels liberates their carbon content and this leads to CO2 emissions. In 2008, UK emissions were 532 MtCOe. Electricitygeneration is responsible for the production of about a third of the total. The amount of carbon associated with each of the main energy carriers varies widely: Carbon intensity of different fuels kg(CO2)/kWh Where a building relies on conventional forms of energy, total CO2 emissions are likely to be minimised if gas is used to provide the space and water heating. Using electricity is likely to result in substantially higher CO2 emissions. [Source: Approved Document L2A]
Electricity generation efficiencies The efficiency of electricity generation depends on the mix of generating plant used. Plant Efficiency Conventional coal-fired power station 38% 1st generation Combined Cycle Gas Turbine (CCGT) 45% Advanced CCGTs 53% Average UK efficiency 40% Transport and distribution grid losses account for a further 9% of the energy supplied to the grid. A coal-fired power station will deliver about 35 units of energy to the final consumer for every 100 units of fuel input.
Electricity generation carbon intensity The carbon intensity of electricity has fallen by 50%since 1970 as a result ofdecreasing reliance on coal-fired generating stations. [Source: DBERR, 2008]
Decarbonisation of electricity generation A major plank of the Government’s strategy to reduce greenhouse gas emissions by 80% by 2050, set out in The UK Low Carbon Transition Plan, is to decarbonise the supply of electricity by increasing the share of renewables, increasing nuclear capacity and using clean coal technology: • Renewables • Large scale wind • Microgeneration • Small scale wind • Photovoltaics • Nuclear • 2008 White Paper on Nuclear Power: nuclear power is low carbon, affordable, dependable, safe and capable of increasing diversity of energy supply • Clean coal (CCS) • Carbon Capture and Storage (CCS) – has the potential to reduce emissions from fossil fuel power stations by up to 90%
Decarbonisation of electricity generation According to The UK Low Carbon Transition Plan, by 2020 the carbon intensity of electricity generation will have declined significantly as a result of the higher proportion of renewable energy used in generation. By 2050, it will have reduced even further, as a result of nuclear power stations coming on stream and the use of clean coal technologies.
Renewable energy in electricity generation Renewable energy accounted for 5.5% of electricity generation in 2008 Increased significantly since 2002 when Government introduced the Renewables Obligation (RO): requires all licensed electricity suppliers to supply a specified and growing proportion of their electricity from renewable sources, and provides financial incentives to do so. Biofuels account for over 80% of renewable energy sources, wind about 10%. [Source: DBERR, 2008]
Renewable energy in electricity generation The UK Renewable Energy Strategy (Cm 7876, 2009) commits the UK to produce 15% of its energy from renewable sources by 2020 (currently 2.3%) and 30% of its electricity from renewable sources by 2020 (currently 5.5%). These are legally binding targets. Wind The growth in renewable electricity generation will come from onshore and offshore wind and from small scale renewable technologies (small scale wind and photovoltaics)
Electricity generation and sector usage Fuels used for electricity generation and sector usage of electricity Mtoe, 2006 The chart below shows that the domestic sector consumes about a third of all the electricity consumed in the UK [Source DBERR a, 2007]
Domestic energy use by fuel Electricity accounts for 20% but gas accounts for almost three quarters of the fuel used in the domestic sector.
Energy use in the domestic sector Energy is delivered to the domestic sector to satisfy 4 categories of demand: Space heating, Water heating, Cooking, Lights and appliances The chart below shows the proportion of energy consumed in each category of demand
Trends in domestic sector energy use Energy use for heating has continued to grow (because of increased ownership of central heating and higher controlled internal temperatures) Use of hot water has increased significantly (as a result of changing lifestyles) Electrical use for lights and appliances has more than doubled since 1970
Domestic sector carbon emissions UK produced 542 million tonnes of CO2 emissions (MtC02) in 2007. Emissions from the domestic building stock were responsible for 142 MtC02; 27% of the total. Carbon emissions are 9% lower than in 1990. Space and water heating is responsible for 73% of domestic emissions. Over 80% of heating systems in UK are fuelled by gas.
Types of technology Low or zero carbon energy (LZC) is the term which is applied to renewable sources of energy and also to technologies which are either significantly more efficient than traditional solutions or which emit less carbon in providing heating, cooling or power (CIBSE, 2006) A number of factors influence integration of these technologies into buildings: • Almost all buildings in UK are connected to the national electricity grid, and the majority of buildings (about 80% of dwellings) have natural gas. • Costs associated with providing and maintaining these connections are small, for majority of buildings. • Providing renewable energy systems which have a reliability of supply which is equivalent to that of the electricity and gas network would be technically difficult to achieve, and expensive. • Providing buildings which rely totally on renewable energy systems requires a re-evaluation of the building envelope, as well as all of the energy-using systems contained within the building, e.g., space and water heating systems, cooking systems, cooling systems, lights and appliances. Therefore, the aim should not be to completely replace non-renewable energy systems with renewable energy systems, but to incorporate renewable energy systems where possible, in order to reduce the consumption of fossil fuels.
LZC energy technologies: policy drivers In 2003 Merton became the first local authority in the UK to include a policy in its Unitary Development Plan that requires new developments to generate at least 10% of their energy needs from renewable energy. This is the so-called Merton Rule. The Merton Rule has been adopted by many local planning authorities • Planning Policy Statement PPS22: Renewable energyrequires planning authorities and developers to consider opportunities for including renewable energy in all new developments. • The Code for Sustainable Homes will require all new homes to be zero carbon by 2016,which will require on-site renewable energy generation • Microgeneration is small-scale production of heat and/or electricity from a low carbon source. Aim of Government’s Microgeneration Strategy, is to ‘create conditions under which microgeneration becomes a realistic alternative or supplementary energy generation source for the householder, the community and small business’ (DTI, 2006). According to a study by the Energy Saving Trust, microgeneration could meet 30–40% of UK’s current electricity demand by 2050
LZC energy technologies: penetration There are few LZC installations in the UK currently: a total of 107,200 in 2005, including 25,000 households with community-scale CHP. Although the figures are for both the domestic and non-domestic sectors, nearly all of them are installed on homes - ie only four out of every 1000 homes have any LZC energy. The majority (73%) of these are solar water heating systems. Very little electricity is generated from existing LZC installations. Most photovoltaic and micro-wind installations have been grant aided. Advancing from the small handful of zero carbon homes currently being built to 240,000 homes a year within nine years will challenge everyone connected with the industry, including house builders themselves, product manufacturers, energy suppliers, designers, surveyors, planners, insurers, regulators and house buyers themselves. [Calcutt, 2007] The Low Carbon Buildings Programme (LCBP) launched in April 2006, giving grants to a variety of microgeneration installations in homes, public buildings and businesses. The total number of approved applications for installations using LCBP grants in the first two years was 5,595, of which 3,339 were solar thermal.
LZC technology classification The LZC technologies can be classified according to whether they produce electricity, heat or both heat and electricity.
LZC (renewable) electricity There are two main renewable technologies that produce electricity: • Wind turbines vary in design, although the most common ones use three blades, mounted on a horizontal axis, which drive an electricity generator. There have been significant technical advances over recent years. One kilowatt units are now available for household installation, while the largest turbines can have a capacity of up to five megawatts. • Solar photovoltaics (PV), generates electricity from sunlight using roof-top panels or tiles. The panels usually contain two or more layers of silicon, which produce an electrical charge when exposed to light. Solar photovoltaics are examined in a later lecture, here a brief introduction is given to wind turbines.
Wind turbines Wind power is potentially the UK’s most cost-effective renewable resource. The UK has an abundance of good-quality wind resource and large-scale wind power is the UK’s preferred renewables option. Wind turbines convert the kinetic energy of the wind that passes through the swept area of the rotor into electrical energy by means of a rotor, a mechanical drive train (usually including a gearbox) and an electrical generator, mounted on a tower. The economics of wind power are driven by: • Wind speed: an increase in wind speed results in a greater than proportional change in rated power.Rated power is proportional to the cube of the wind speed. • Rotor diameter: an increase in rotor diameter results in a greater than proportional change in rated power A 1MW turbine can provide enough power for 640 homes
Wind turbines The economics favour large scale wind generation. • Small 600W wind turbine costs about £388/t of carbon saved • Large 2MW wind turbine costs about £54/t of carbon saved However, smaller scale generation (at the level of a housing development, industrial/commercial buildings) could make a marginal contribution where the location is favourable. The following location constraints need to be considered in the impact on the built environment: • Grid connection is necessary to cope with peak demands and periods of intermittent supply caused by calm conditions • Wind in urban areas or around buildings is often of poor quality: unpredictable with significant disturbance • Average wind speeds are likely to be greater in rural and outer suburban areas but obstructions such as trees can reduce wind speeds and cause turbulence • Planning consent is required (seldom classed as ‘permitted development’) and issues arise such as noise, vibration and visual intrusion • The taller the mast, the better: near the ground, friction effects slow the wind As a result of unfavourable wind quality and occurrence and unfavourable economics it is unlikely that wind turbines installed on individual dwellings will be a realistic and viable option.
Wind turbines The Energy Saving Trust's field trial of domestic wind turbines concluded that: • Wind turbines do work but only when installed properly in an appropriate location. • There is the potential for delivering nearly 2 million tonnes of CO2 savings from domestic small scale wind turbines in the UK. This is equivalent to the annual emissions of approximately 350,000 homes. • There is a potential to generate up to 3,500GWh electricity per annum from domestic small-scale wind turbines in the UK.
Financial incentives for LZC electricity • Earlier this month (Feb 2010) Government launched Feed-in tariffs for small scale low carbon electricity generation This “clean energy cashback” will allow many people to invest in small scale low carbon electricity, in return for a guaranteed payment for the electricity they generate. It is expected that by 2020 the scheme will support over 750,000 small scale low carbon electricity installations and will have saved 7 million tonnes of CO2. • The specified maximum capacity for the scheme will be set at 5MW. It will support new anaerobic digestion, hydro, solar photovoltaic (PV) and wind projects up to that 5MW limit (and a number of micro-CHP installations), with differing generation tariffs proposed for different scales of each of those technologies.
Feed-in tariffs: the economics In this example, the site generates (G) 2,000kWh per annum (using a retrofitted <4kW solar PV panel) . It exports (E) 50% of its generation to the local electricity network when the household does not use it. The other 50% is used on-site (O). The household uses (U) a total of 4,500 kWh pa, therefore will need to import (I) 3,500 kWh from its electricity supplier. The household will receive a payment of £856 pa (generation tariff payment of 2,000 kWh x 41.3 p/kWh = £826, plus export tariff payment of 1,000kWh x 3p/kWh = £30). It also benefits from the 1,000 kWh it generates and uses on-site as that will offset 1,000 kWh it would otherwise have had to buy from the electricity supplier. Assuming an import price of 13 p/kWh this would be a saving of £130 (1,000 kWh x 13 p/kWh).
LZC heat There are three main LZC technologies for producing heat: • Solar water heating systems use flat plate or airtight (evacuated) tubes, mounted on south facing roofs using solar radiation to heat water. • Heat pumps capture thermal energy stored in the ground, water or air to supply hot water for heating purposes. Ground source heat pumps (GSHPs) use the heat stored in the ground to heat fluid circulating through pipes in the ground: a heat exchanger extracts the heat and then a compression cycle (similar to that used by refrigerators) raises the temperature to, typically, supply hot water for heating purposes. GSHPs are not carbon neutral as they require electricity for the pump and compressor. However, up to five units of heat can be provided for one unit of electrical energy used • Space or water heating can be generated from biomass stoves or boilers, which burn wood or other fuels such as energy crops (eg, willow or miscanthus). Both solar water heating and heat pumps will be covered in later lectures. Biomass stoves/boilers are briefly covered next.
Biomass boiler or stove An ordinary wet central heating system can be based around a boiler that burns wood chips or pellets. As supplementary heating, or in very energy efficient homes, a single woodstove can be used. Both systems require on-site storage of the biomass, and a boiler requires an automatic-feed mechanism, so this is best if part of a community CHP scheme. • The opportunities for the penetration of biomass boilers at individual household level are limited: • Most suitable in areas where biomass is readily available, such as for rural or suburban homes. • Domestic biomass boilers require more room than standard boilers and are unlikely to fit into small properties. • Exhaust gases require a flue vent that rises above the roofline of the building; planning permission may be required • Energy density of biomass is low: wood 4kWh/kg whereas biomass is 12kWh/kg, therefore greater mass and storage is needed • Boiler capital costs 4-5 times that of gas, operating costs higher • Output sensitive to moisture content of fuel Biomass boiler
Renewable Heat Incentive • Government is proposing to introduce, from April 2011, a Renewable Heat Incentive (RHI) to provide financial support to increase significantly the level of renewable heat generation • Heating accounts for approximately half of the UK’s CO2 emissions and more than half of average domestic energy bills. Currently, only 1% of our heating comes from renewable sources. • The RHI scheme will support a range of technologies, including air, water and ground-source heat pumps (and other geothermal energy), solar thermal, biomass boilers, and renewable combined heat and power • Tariff levels are proposed to provide a rate of return of 12% on the additional capital cost of renewables, with a lower rate of return of 6% given to solar thermal.
LZC heat and electricity Both heat and power can be generated together efficiently using Combined Heat and Power (CHP) systems, also known as cogeneration. CHP involves generating electricity on-site and using the heat that is a by-product of the generation process. For a wide range of buildings, CHP can offer an economical method of providing heat and power which is less environmentally harmful than conventional methods. These systems use either natural gas or biomass as a fuel to provide electricity and heating simultaneously. Whereas conventional large power stations emit heat into the environment as a by-product of electricity generation, CHP systems capture this thermal energy to use locally. Typical efficiency is around 65–85%, which is much greater than typical power stations. Also, because he electricity is generated on-site, the transmission losses associated with centralised generation do not occur. Depending on the size and location of the plant, this may be purely for domestic use, in the case of micro-CHP, or to provide community or district heating through a heat distribution network
Combined Heat and Power (CHP) Each kWh of electricity supplied from the average fossil fuel power station results in the emission of around half a kg of CO2. Typically, gas-fired boilers emit around one fifth of a kg of CO2 per unit of heat generated. CHP has a lower carbon intensity of heat and power production than these separate sources and this can result in around a 30% reduction in emissions of CO2. The environmental benefits can be seen in the diagrams below. CHP produces far less CO2 emissions with a reduced primary energy input than conventional energy supply systems. Conventional energy supply Energy supply using CHP [Source: CIBSE (2009) ]
CHP technology The basic components of a CHP system are: • An engine to drive the generator • Fuel system • Generator to produce electricity • Heat recovery system to recover useful heat from the engine • Cooling system • Combustion and ventilation air systems • Control system • Enclosure Typical small scale CHP system [Source: Carbon Trust, 2004]
CHP applications CHP can be implemented at a wide range of scales: • Large-scale CHP - generally above 1MWe electrical and can range from large diesel engines to gas and steam turbines. Tend to be non-standard, with each site having a tailor made design. Suitable for airports, large hospitals and large district heating systems. • Small-scale CHP - most building installations use small-scale packaged units fuelled by natural gas, with electrical outputs of up to 1MWe. All of the components come assembled ready for connection to the building’s central heating and electrical distribution systems. • Micro-CHP units - several boiler manufacturers have produced units that are capable of serving a single dwelling, are no bigger than conventional boilers, and if integrated correctly, are capable of replacing existing gas-fired heating boilers The main applications for CHPin buildings are those sites where there is simultaneous demand for heat and electricity for extended periods. Three sectors have proven to be particularly suitable: • Hotels • Hospitals • Leisure facilities with swimming pools • Universities
CHP in buildings Number and capacity of CHP schemes installed in buildings, by sector, 2008 [Source: DUKES, 2009]
CHP examples Examples of small scale CHP units
CHP capacity In 2008, just over 7% of the total electricity generated in the UK came from CHP plants, representing 5.5 GWe capacity. In 1999 the Government set a target of 10 GW installed capacity by 2010 and developed a strategy and incentives in order to achieve this. Target not met primarily as a result of unfavourable price differentials for gas and electricity (‘spark spread’). New projection is 6.2 GW installed capacity by 2010, rising to 15.5 GW by 2020. [Source: DBERR, 2007]
Integration of CHP into buildings CHP installations cannot be considered in isolation, but must be correctly integrated with any other energy systems on site. • A building’s heat and power requirements will not be exactly mirrored by the output of the CHP plant, and there will generally be a need for ‘top-up’ heat and power unless there is excess capacity that can be exported. • CHPdoes not necessarily replace conventional boilers, although it often replaces boiler capacity. To maximise the benefits, a CHP installation will usually be designed to meet the base heat load. This ensures that the plant operates for as many hours as possible. Additional boiler capacity is required to meet the peak heat demands. Sizing of CHP plant should only be done after consideration of energy efficient measures as these may have a significant effect on the site demand profiles. Future changes in energy requirements should also be anticipated to avoid the unit becoming oversized.
Micro-CHP CHP for small buildings is available as the result of development of small gas (or oil)-fired engines. Two types available: • Internal combustion engines: supply electrical output of 5kW+ and heat output of10kW+. Suitable for groups of flats, residential homes, small commercial premises. Need to operate for 10hrs+ a day to be economic. • Stirling engines: electrical output of 1kW+ and power to heat ratio of between 1:6 and 1:3, most suitable for larger new houses, older houses with high heat demand and smaller commercial premises. The Whispergen 0.8kWe Stirling engine system is one micro-CHP unit currently marketed in UK domestic sector Whispergen micro-CHP unit in a kitchen
Micro-CHP: carbon savings Carbon saving depends on • Amount of electricity generated • Carbon intensity of grid electricity displaced In example below, CHP unit produces same heat output as a conventional boiler, (at a lower efficiency) but the CHP unit also produces 1,780kWh of electricity. The net effect is to save 370kgCO2pa However, if there is a low heat demand, CHP could produce more, not less carbon, as there would be little electricity generated to offset the lower thermal efficiency of the CHP unit. Example of how a Micro-CHP system can save carbon *To power controller, pump and fan * [Source: Carbon Trust, 2007] A carbon emissions factor of 0.568kgCO2/kWh is assumed for locally generated electricity from Micro-CHP
Micro-CHP: power to heat ratio The power-to-heat ratio is important when assessing the potential end uses and carbon savings for different units. The higher the power-to-heat ratio the higher the proportion of electrical output and therefore the greater the potential carbon savings for a given energy input. Stirling engine Micro-CHP systems typically have power to heat ratios in the range of 1:10 to 1:4, so they are suited to operating in a ‘heat-led’ fashion in domestic environments, sized to meet the full heat demand. They are also usually sized to generate electricity at a level that ensures that a reasonable proportion is used within the household rather than exported to the grid. Theoretical carbon savings for different power-to-heat ratios [Source: Carbon Trust, 2007]
Micro-CHP: evaluation Field trials carried out by the Carbon Trust suggest that: • Carbon and cost savings from Micro-CHP are higher for buildings where they can operate for long and consistent heating periods • In small commercial applications, Micro-CHP systems can provide carbon savings of 15% to 20% • Micro-CHP systems have the potential to provide carbon savings of 5% to 10% for older, larger houses with high and consistent heat demands • For smaller and newer houses, the typical carbon savings will be less than 5% Range of carbon savings expected for domestic and commercial Micro-CHP* older, larger houses [Source: Carbon Trust, 2007] *relative to a typical A-rated condensing system boiler and based on carbon emissions factor of 0.568kgCO2/kWh for displaced electricity
Micro-CHP: dis/advantages Advantages • Combustion efficiencies of up to 95% • Relatively low cost and simple installation • Could directly replace existing central heating boilers • Heating operation coincides with peak demand periods for electricity • Ability to export excess electricity to National Grid Disadvantages • Inherent carbon emissions • Seasonal patterns of electricity generation, restricted to heating season • Continuing reliance on grid electricity to make up shortfalls • Viability affected by fluctuating price of grid-generated electricity • Only viable in dwellings with higher thermal requirements (large or less well insulated)
Renewable energy in buildings: early examples The Beddington Zero Energy Development (BedZed), Sutton, London • A 130kWe wood-fuelled combined heat and power (CHP) unit • 777m2 of photovoltaic panels mounted on the south-facing elevations of the buildings are used to power up to 40 electric vehicles. The Hockerton Houses, Southwell, Nottinghamshire The Autonomous Urban House, Southwell, Nottinghamshire • Two grid-linked wind turbines (11kW rating) - producing 9000kWh annually. • A 7.65kW grid-linked roof-mounted photovoltaic array - producing 5700kWh annually. • Building integrated 2.2kW grid-connected PV system sited on a pergola in the garden
District heating • Community or district heating, where buildings are collectively served by the same central heating plant, has been widely adopted in Europe. In particular Denmark where it is now the heating technology of the first rather than last choice. • In UK, less than 1% of homers are served by Community heating • Community heating is not new to UK: Manchester, Glasgow, Dundee and Chesterfield had district heating systems in the early 1900s. Hit a peak in the late 1960s early 1970s in the UK, when over 500 district and group heating systems were installed, serving in excess of 400,000 users. • In the 1980s, development virtually ceased due to poor technical performance of earlier schemes. However, some UK cities do possess substantial community heating networks, notably Sheffield, Nottingham, Southampton and Birmingham
District heating • However, community heating is now seen as a part of the solution for delivering sustainable communities: • Significant carbon savings are available if heat is supplied from renewable energy sources such as biomass or geothermal heat, or using the waste heat from power generation (CHP). • Introduction of Code for Sustainable Homes means that low carbon solutions, such as community heating, are a key consideration for new developments. • Community/district heating is most appropriate in the following circumstances: • Dense housing, flats in particular offer high heat demand density. The role of CHP is particularly important with flats, as these have insufficient roof or garden space for the solar technologies or heat pumps, lack the storage for individual biomass burners and are often not permitted to have individual gas boilers, for safety reasons. • Off-gas communities, where oil, solid fuel heating, or electricity is displaced • In new and dense build, typically over 50 dwellings per hectare where electrical and gas network infrastructure is not already installed. Cost of heating pipes is about 25% of the full installation, remaining costs being for trenching etc. So economies obtained by installing all services simultaneously.