Susceptibility Weighted Imaging (SWI)
1.26k likes | 5.54k Vues
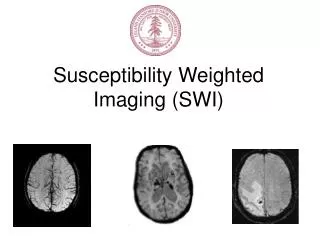
Susceptibility Weighted Imaging (SWI). Susceptibility Weighted Imaging?. SWI is a magnetic resonance (MR) technique that utilizes the magnetic susceptibility differences Illuminate small vessels and veins in the brain Sensitive to iron & calcification.

Susceptibility Weighted Imaging (SWI)
E N D
Presentation Transcript
Susceptibility Weighted Imaging? • SWI is a magnetic resonance (MR) technique that utilizes the magnetic susceptibility differences • Illuminate small vessels and veins in the brain • Sensitive to iron & calcification Haacke, Mark, et. al. Magnetic Resonance in Medicine 52:612–618 (2004)
SWI: Introduction • Acquisition = T2*-weighted sequence to enhance the visibility of susceptibility differences. • High-resolution 3D gradient-echo (with flow compensation) • Long TE (~40ms at 1.5T, ~25ms at 3T) to get T2* weighting + • Extra post processing using the phase image. Magnitude Phase
History of SWI • Reichenbach, Haacke et al. 1997 • “MR venography” or “BOLD venographic imaging” • From 1997 – 2003 • Lots of clinical papers • Haacke et al. 2004 • “Susceptibility Weighted Imaging” • Caution: Sometimes the term susceptibility weighted imaging is used loosely!
Major Clinical Applications for SWI • Stroke • Brain Tumors • Traumatic Brain Injury • Vascular Malformations • Neurodegenerative Diseases
Stroke Nathaniel D. Wycliffe, JMRI 20:372–377 (2004)
Stroke minIP SWI vs. CT Thomas, Bejoy, et. al. Neuroradiology (2008) v50
Brain Tumors CE T1 weighted vs. SWI Sehgal, Vivek, et. al. Journal of Magnetic Resonance Imaging (2005) v22
Traumatic Brain Injury GRE Image vs. SWI postprocessing Thomas, Bejoy, et. al. Neuroradiology (2008) v50
Vascular Malformations Routine GRE vs. minIP SWI Thomas, Bejoy, et. al. Neuroradiology (2008) 50:108
Neurodegenerative Diseases SWI minIP vs. SWI phase image Thomas, Bejoy, et. al. Neuroradiology (2008) v50
Post-processing Steps to a Susceptibility Weighted Image… Background comes later!
Brief Overview of Steps: • Generate a high frequency phase image • Construct a normalized phase mask • Enhance the magnitude image with the phase mask to get the SWI • Optional: produce a minimum intensity projection to produce a SWI minIP 3T
1) Generate high frequency phase image • Use a 2D Hanning filter (in k-space) to smooth the original image • Divide the original image by the smoothed image • A phase unwrapped image • An image with high frequency phase information Phasemap of original Image Phasemap of hanning filtered image High pass phase Image
2) Phase Mask • A phase mask is produced as follows: - If phase >=0, then the resulting phase mask value = 1 - If phase < 0, then the mask value is found by (ph(x) + pi)/pi • The resulting normalized phase mask (ranging from 0 to 1). High pass data Normalized phase mask
3) Enhance Magnitude Image • Multiply the phase mask by the magnitude image (phase mask can be multiplied 3- 8 times) SWI Processed Image Phase mask.^5 X Orig. Magnitude X
Enhanced magnitude comparison… Original image SWI image
4) Minimum Intensity Projection • A minIP, further enhances the contrast of susceptibilities in the final SWI image • A minIP usually done over 5 to 10 slices SWI processed image Final minIP
Modeling the susceptibility effects in venous system Difference fields for an infinitely extended circular cylinder • Venous imaging: based on the magnetic susceptibility difference between oxygenated and deoxygenated hemoglobin • Papers describing this: • Reichenbach & Haacke, NMR Biomedicine 41:453 (2001) • Springer, NMR in Physiology and Biomedicine 1994: 75 • Vessel || to B0: intravascular frequency shift • Vessel |_ to B0: intravascular AND extravascular frequency shift • SEE NOTES on WORD DOC!
Graph the result… Signal dependence on venous blood volume fraction () and TE • Since the local magnetic field in and around blood depends on venous blood volume fraction (), TE can be adjusted to reveal large signal cancellation • Signal cancellation • TE ~ 40ms (1.5T), TE ~ 25ms (3T) used to get maximum signal cancellation without phase aliasing • But there’s more – we can use the phase information…...
Phase image can be used to further enhance signal cancellation effects…. • Referring back to the result for TE ~ 50ms • = - when θ = 0º (|| to B0) • - < < 0 for 0º < θ < 54º • A ‘negative’ phase mask filter can be created: • 0 < < : phase mask filter = 1 • - < < 0: phase mask filter linearly scaled between 0 and 1 • But! What about vessel orientations θ > 54º : • For 54º < θ < 90º, the phase > 0 • Therefore, negative phase mask will miss part of venous vascular information
Negative & Positive phase masks • Complicated phase behaviour • Can use triangular phase mask • But result in fat vessels and blurring of veins => negative phase mask used. Reichenbach & Haacke NMR in Biomedicine, 14:453 (2001)
SWI at 1.5T 2 4 reference Different phase mask orders 6 8
SWI at 3T 2 4 reference Different phase mask orders 6 8
Final comparison at 3T: reference SWI image
SWI minIP at different field strengths 1.5T 3T 7T
Acquisition of SWI Current Method: 3D Gradient-Echo imaging (3D GRE) • Long scan time (32 partitions takes 7 min.) Future Method? 3D multi-shot EPI
3D EPI • 3D EPI has more k-space coverage per TR => faster scan time (~2 min v 7 min) and/or higher SNR. • Disadvantages: - geometric distortion ( 1/#shots) - signal dropout GRE EPI
Careful with your flip angle/TR, and no rfspoiling! Practical things: 1.5T TE=40ms θ = 30º θ = 20º
Conclusion SWI has promising applications in the clinics (probably just a good compliment to other techniques) Good delineation of venous network and some tissue pathologies Ability to image tumors without contrast agent Demonstrates vascular nature of a lesion Etc.. Performs better with higher field strength A bit ambiguous? Disadvantage: long scan times Advantage: we can get abstracts by speeding it up
Acknowledgements: Matus Straka, Karley Marty, Stefan Skare, Roland Bammer Thank You!! Questions?