Download
1 / 10
100 likes | 130 Vues
Delve into the macroeconomic analysis of unemployment and aggregate supply & demand, exploring the 4 types of unemployment, the classical economists vs. Keynesian economics, AD & AS curves, and phases of the AS curve. Gain insights into the factors affecting inflation, GDP, and the current economic recession.

E N D
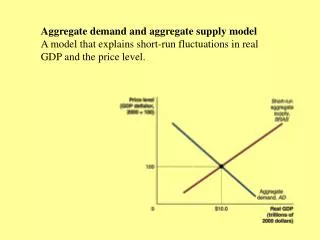
Aggregate Supply & Demand Model Macroeconomic Analysis
4-Types of Unemployment • Structural • Skills do not match demand for labor • Cyclical • Too low a level of aggregate demand • Frictional • Temporarily between Jobs • Seasonal • Out of work based on time of year
Old School: The Classical Economists • Markets are naturally self regulating • Nogovernment intervention necessary • Recessions are temporary Adam Smith (1776), Thomas Malthus, David Ricardo, etc.
“New” School: Keynesian Economics • The Great Depression challenged Classical View • John Maynard Keynes (1883-1946)refuted the classical theory of Adam Smith • Argued investment by Government can moderate the “ups & downs” of business cycle John Maynard Keynes
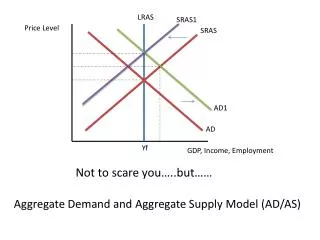
AD & AS Curves • Aggregate-demand curve (AD)- the demand curve for the entire economy • demand for all products and services from households, businesses, & government at each price level • Aggregate-supply curve (AS)- the supply curve for the entire economy • the supply of all goods and services produced by all businesses at each price level
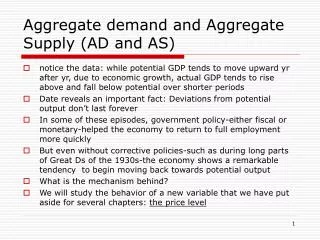
Inflation AD1 GDP Aggregate Demand (AD) AD Curve represents GDP GDP = C + I + G + (X-M)
Reminder: “Full” Employment • Approximately 4.5% unemployment • allows for people temporarily out of work (frictional) and people who have skills who do not match jobs available (structural) • Levels below 4.5% unemployment run the risk of rising inflation
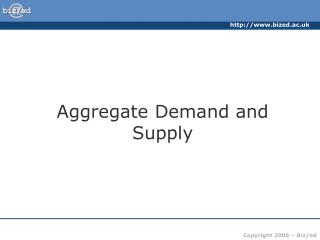
(1) Flat:occurs during recessions Unemployment is high, GDP is low (3) Vertical Section: Economy is growing too fast. Unemployment is below Full Employment (4.5%) (i.e. there are too many jobs!); AS1 (2) Sloping Section: no recession, Unemployment is relatively low but above the Full Employment level (4.5%) ; this is the “sweet spot” 3 Phases of AS Curve Inflation 3 2 The economy has a SPEED LIMIT 1 Real GDP
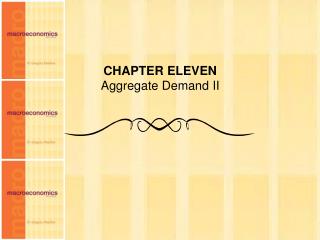
AS1 AD1 CurrentEconomic Recession Unemployment is at 9.7% GDP is -1.0% Inflation is non-existent Inflation Real GDP
AS/AD Model Worksheet • See what you understand