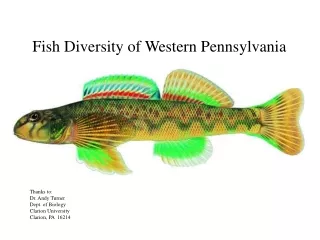
Examining Relationships Between Habitat Diversity and Fish Species Diversity
100 likes | 232 Vues
This study explores the ecological principles governing fish diversity within stream environments. It focuses on the principle of limiting similarity, niche differentiation, and the impact of environmental heterogeneity on species richness. The primary purpose is to test the hypothesis that increased habitat diversity leads to greater fish diversity due to competition for niche space. Predictions indicate a positive correlation between fish and habitat diversity. Additionally, various factors, including predation and historical geographic influences, are considered in the analysis of fish assemblage composition.

Examining Relationships Between Habitat Diversity and Fish Species Diversity
E N D
Presentation Transcript
Ecological Principles of Diversity • Principle of Limiting Similarity- There is a limit to the similarity of coexisting competitors; they cannot occupy the exact same niche. • Niche Separation / Differentiation -Competitors use different resources to coexist. • Environmental heterogeneity - Creates more niche possibilities; therefore, higher environmental diversity leads to higher species diversity.
Purpose, Hypotheses, and Prediction • PURPOSE: Test the idea that increased environmental/physical diversity leads to increased species diversity. • Hypotheses and predictions • H1: Fish diversity increases with habitat diversity in the physical environment, due to competition for niche space and the principle of limiting similarity. • Prediction: There will be a significant positive correlation between fish diversity and habitat diversity.
Other Possible Hypotheses The fish assemblage is structured by: • Predation or number of trophic levels • Flooding • Glacial and geographic history (age of the stream, and its history of isolation) • (more are possible…use your knowledge of ecology to think of a few more)
1. Physical (our focus) Water depth Current velocity Substrate type 1. Physical (extra) Temperature 2. Chemical Dissolved O2 Ions pH 3. Biological Other organisms present Nutrient input Nutrient cycling Habitat Parameters that Could Influence Species Composition Note: We are not measuring all factors, so this is not a complete test of the hypothesis (we can support but not falsify).
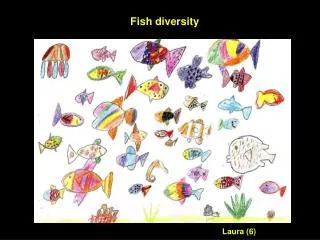
Background for Calculations • Diversity addresses 1) how many categories exist, and 2) how evenly the categories are represented. • For example, we may have 2 communities with 7 species (species richness = 7) and 21 total individuals, but each species may not be represented evenly. Less Diverse More Diverse
A. B. E. C. D. F. H. G.
A. B. H’= 1.24 H’= 1.38 E. H’= 0.41 C. D. H’ = 1.10 H’ = 1.61 F. H. H’= 1.39 H’= 0.69 G. H’= 1.39
Diversity Calculations • For the fish assemblages and habitat parameters we calculate diversity using the following equation: H’=-∑ pilnpi Where pi = # of individuals in a category/total # of individuals
Is There a Correlation Between Habitat Diversity and Species Diversity? • Today, we will compile fish diversity and habitat evenness results from all groups in our lab. • This correlation will only involve two or three data points, so it will probably not be significant. Therefore, we also will examine some data from a previous year to increase sample size (n).