Download
1 / 63
630 likes | 778 Vues
Voting Behaviour in the UK 1945-2005. The second slide contains advice on the use of the slide show for users relatively new to the use of PowerPoint presentations. Advice on Using the Slide Show.

E N D
Voting Behaviour in the UK 1945-2005 The second slide contains advice on the use of the slide show for users relatively new to the use of PowerPoint presentations.
Advice on Using the Slide Show • The slide show is accessed via the Politics Module Page and there are also links within the show to relevant Excel diagrams, to more detailed class notes and to a few relevant websites. • To activate all of these links and move back and forth between different types of documents make sure that you click on Browse and activate the Full Screen version. Otherwise you will be unable to return to specific slides. • Using the full screen version you can return from Excel diagrams and from external weblinks to the previous PowerPoint slide by clicking on PowerPoint slide at the bottom of your screen. • However if you use a link from a PowerPoint slide to Class Notes you can return to the beginning of the PowerPoint show but not to a specific slide but you can then quickly use the links on Slide 3 to get back to where you want to be. • Also using the full screen version you can navigate within the PowerPoint presentation by clicking on the arrows or square block icon which appear in white at the bottom left hand corner of each slide. Clicking on the square block icon enables you to choose any slide or to end the show. • But you probably knew that!
Contents of the Presentation • Sources of Data • UK General Election Results: 1918-2001 • Shares of the Vote: 1918-2001 • Recent Opinion Poll Data • Socio-economic Factors affecting Voting Behaviour • Models of Voting Behaviour: An Introduction • The Era of Party Identification and Class Voting • Gender and Voting Behaviour • Partisan Dealignment and Class Dealignment • Issue Voting Model • Radical Voting Model • Ideological Voting • Part Two • Recent UK General Elections : Results and Trends • Voting Behaviour and Social Class 1974-2005 • Region and Voting Behaviour 1997-2005 • Analysis of individual General Elections.
Sources of Data • The data in the following three slides are taken from various House of Commons Library Research Papers. These papers contain far more useful data than I can copy[!] here. • The data on recent General Elections are taken primarily from the MORI site.
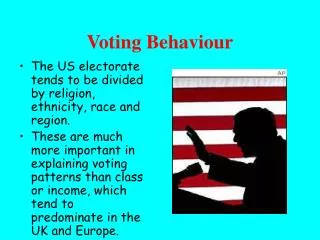
Socioeconomic Factors Affecting Voting Behaviour • Social Class • Family • Local Community • Gender • Age • Ethnicity • Region • Religion
Models of Voting Behaviour: An Introduction • The Party Identification Model • The Issue Voting Model • The Radical Model • The Ideological Voting Model
The Era of Party Identification and Class Voting [a] • 1945-1970 • No significant challenge to the 2 Party system dominated by Conservative and Labour parties • Patterns of voting behaviour relatively stable: few voters switch political allegiance • Relative stability explained in terms of the Party Identification Model of voting behaviour in which many voters identified with a preferred political party more on the basis of its overall image than on the basis of specific party policies • Differences in political socialisation according to social class, parental voting, nature of local community, region, ethnicity, religion, gender and age resulted in similar variations in party identification.
The Era of Party Identification and Class Voting [b] • Social Class was seen as the most important determinant of voting behaviour as illustrated in the well known PGJ Pulzer quotation • Social class was measured by occupation as in various classificatory schemes such as those used by the IOM or the RG. Later analysts [e.g. Heath, Curtice and Jowell] would point to the limitations of such schemes. • The distinction between objective and subjective social class is also significant • Voting according to social class reached its zenith in the general elections of 1950 and 1951 when approx 2/3 of working class voters voted Labour and approx 4/5 of middle class voters voted Conservative. • As already mentioned this class voting was explained in terms of differential class socialisation leading to differential party identification according to social class • Since few voters were voting Liberal this implied that approx 1/3 of working class voters and 1/5 of middle class voters were “deviant voters” voting against their “natural class party”
The Era of Party Identification and Class Voting [c] • As mentioned even at the zenith of class voting approx 1/3 of working class voters were voting Conservative. • One significant explanation for working class Conservatism was provided by Mackenzie and Silver in which they distinguished between deferential and secular working class Conservatives. • Deferential Conservatives believed that the inequalities of the social order were nevertheless essentially justified and that the relatively aristocratic Conservative Party were best suited to govern the country. Government was “ in their blood.” • Secular working class Conservatives were often relatively young, affluent and opposed to fundamental Labour policies on the trade unions, the welfare state and the nationalised industries
The Era of Party Identification and Class Voting [d] • Also as mentioned approx 1/5 of middle class voters were voting Labour at the height of class voting. • These included m/c voters who worked in the public sector, witnessed the effects of poverty on disadvantaged groups and believed that Labour was most likely to expand the public sector, thereby also protecting public sector jobs. • In some cases middle class voters may have been “radicalised” via Higher Education” • They also included middle class voters who had been upwardly mobile out of the working class but retained their working class allegiances. • Some middle class Labour voters may also have supported particular Labour policies, for example on defence and foreign policy.
The Era of Party Identification and Class Voting [e] • PJG Pulzer stated that “Class is the basis of British party politics: all else is embellishment and detail.” We do however need to familiarise ourselves with such details: i.e. with the possible effects of region, ethnicity, age, gender and religion on voting behaviour. • Voters in Scotland, Wales and Northern England were more likely to vote Labour than voters in Southern England. • Ethnic minority voters were more likely to vote Labour than white voters. • Catholic voters were more likely to vote Labour than Protestant voters. • In each of these three cases this could be explained partly [but not entirely] by the indirect effects of social class in that the Scots, the Welsh, ethnic minority members and Catholics are also disproportionately likely to be working class [ which takes us back to the Pulzer quotation]
Families, Parents and Communities • In the era of party identification and class voting, class differences in voting behaviour were explained mainly by class differences in political socialisation. Working and middle class voters will often have been brought up by working class and middle class parents and in working class and middle class communities respectively which increased the likelihood of class voting. • However if working class and/or middle class voters had been brought up by parents who were “deviant voters” they themselves might be more likely to vote “deviantly” • Also it was found that working class voters living in primarily working class communities were more likely to vote Labour than working class voters living in more middle class communities. Similarly middle class voters in middle class areas were more likely to vote Conservative than middle class voters in working class areas. • Impact of Tory Press could be greater in some families/communities than others
Gender and Voting Behaviour [1] • Relationships between gender and voting behaviour are summarised in trends in the so-called gender gap in voting behaviour • The gender gap is defined as the difference between the % Conservative- Labour lead among women and the % Conservative-Labour lead among men. • For example in 1951 the % Conservative-Labour lead among women was 12% and the % Conservative- Labour lead among men was -5% giving a gender gap of -17%. • Click here and scroll down for gender gap trends 1945-2005. Notice that in 2001 and 2005 the gender gap was positive.
Gender and Voting Behaviour [2] • The pro-Conservative/anti –Labour tendencies of female voters relative to male voters for much of the post-war period were explained by the following factors. • Women were less likely to be in employment than men and when they were in employment, less likely than men to be in heavily unionised occupations where Labour voting was most likely. • It was suggested that for much of the post –war period women could on average be described as having a more traditional outlook on life than men. Not a very convincing argument, you might think. • On average women live longer than men and older people are more pro-Conservative and anti- Labour than young people
Gender and Voting Behaviour [3] • The extent of relatively pro-Conservative/ anti-Labour voting behaviour among women always varied according to age and social class. • Also from the 1980s this trend in female behaviour began to be reversed such that in 2001 and 2005 women were relatively anti-Conservative/pro-Labour in comparison with men. • We could argue therefore that as well as partisan and class dealignment, the period from the 1980s onwards experienced a certain amount of gender dealignment although I have not actually seen this term used!
Gender and Voting Behaviour [4] • The changing relationships between Gender and voting behaviour have been explained by the following factors
The Issue Voting Model [a] • In the issue voting model it is argued that both partisan dealignment and class dealignment might be both a cause and effect of issue voting. • In this model it is argued that voters may have become increasingly “rational” and may as a result vote for the party which they believe has the best policies on the issues which they consider to be most salient. Their choice of “best “party is analogous to their choice of the consumer goods which yield the most satisfaction. • It follows that models of Issue Voting, Rational Voting, Policy Voting and Consumer Voting are all fairly similar.
The Issue Voting Model [b] • Opinion pollsters regularly ask samples of potential voters which issues they consider to be most salient and which party has the best policies on each of the salient issues • The saliency of different issues does vary a little from election to election but the state of the economy, health, education and law and order have usually been among the issues considered to be most salient . • It has proved difficult to determine voters’ attitudes to increased taxation with any accuracy. Many claim to support increased taxation to finance improvements in Health and Education but they may lie! • With regard to the economy individuals may vote not according to its overall state but according to how the state of the economy affects THEM! • Here analysts are distinguishing between so-called “sociotropic and egocentric [or pocket book] motivations for voting behaviour • Another important distinction is between positional issues and valence issues.. [see class notes]
The Issue Voting Model [c] • It may be that the Issue Voting Model was helpful in explaining the declining party identification with the Labour Party in the 1970s in terms of declining support for key Labour policies of Nationalisation, increased Welfare State spending and support for the Trades Unions . • However it increasingly came to be argued that the usefulness of the model was undermined by the difficulties of distinguishing between cause and effect in voting behaviour. • Thus voter x might tell a pollster that Party A has the best policies on salient issues and that s/he intends to vote for Party A. However this does not necessarily mean that issues and policies determined the voter’s choice and the answer to the pollster may simply be what one author has called an “obfuscating rationalisation. “ • The Issue Voting Model does not appear to provide a good explanation of the 1983, 1987 and 1992 General Elections. {Click dates for Class Notes}
The Issue Voting Model [d] • In 1997 and 2001 Labour was preferred to Conservative on all or almost all of the salient issues • Labour also had a more attractive image in most respects . • Labour was also perceived as having the best potential PM and the best team of leaders • By 2005 Labour popularity had declined according to all of these criteria. However it was still preferred to the Conservatives but not by so great a margin as in the two previous General Elections. • Perhaps Issue Voting helps to explain these results but the criticisms of the issue voting model remain. It also cannot explain the voting behaviour of the many voters who are still influenced by Partisan identification . • Further discussion is still necessary.
The Radical Model of Voting Behaviour1 • This model was developed primarily by P.Dunleavy and C.Husbands in “British Democracy at the Crossroads • They argued that in the two General Elections of 1974 and in the General election of 1979 governments had had little control over the timing of the General Elections but that this was not the case in 1983 and 1987. • If for example Mrs Thatcher had been forced to call a General election in, say 1981 of 1985 there is little doubt that the Conservatives would have lost: her control over the timing of the General Election affected the results significantly. • The effects of individual issues and policies on voting behaviour have been over-estimated by supporters of the issue voting model mainly for the reasons already mentioned in slidexxx. • Voting behaviour is heavily influenced by sectoral cleavages within social classes: middle class voters who use public sector services[ health care, schools, housing and transport are more likely to vote Labour than middle class voters who rely more heavily on private services. • Similar cleavages are also significant within the working class.
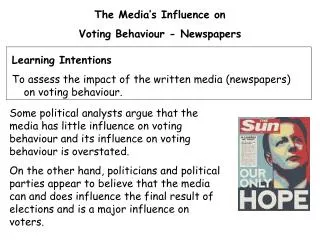
The Radical Model of Voting Behaviour 2 • Dunleavy and Husbands recognise the difficulty of assessing the impact of the mass media on voting behaviour but believe, nevertheless that it is considerable.
Recent UK General Elections • 1979 • 1983 • 1987 • 1992 • 1997 • 2001 • 2005
Seats Won 1979-2005 Con Lab “Lib” SNP/PC Other
Voting Behaviour and Social Class [1] • Click here for 2 Excel Diagrams on Voting Behaviour and Social Class 1974- 1987.Once you reach the relevant Excel Book Click on Charts 2 and 8 or Sheet 1 for the numerical data
Voting Behaviour and Social Class 2 • Click here for two Excel Diagrams on Voting Behaviour and Social Class 1992-2005. Once you reach the relevant Excel book you require Sheet 2 and Charts 5 and 7
Voting Behaviour and Social Class [3] • Click here for 3 further Excel charts: • The decline of the working class and of Labour voting 1945-1997 • The social composition of the electorate 1979-1997 • Class awareness among different social groups 1997 • Charts are derived from tables in The Rise of New Labour [Heath, Curtice and Jowell 2001. Their class schema differs from that used by MORI.
Voting Behaviour and Social Class[4] • Click here for 3 excel charts showing relationships between voting behaviour and social class according to the Heath, Curtice and Jowell schema.
General Election 1992 [2] • Most Polls suggested likelihood of Hung Parliament or even Labour Victory. • Reasons for relative Labour popularity: economy in deep recession; Labour now perceived as more moderate and more united than in 1987 and especially than in 1983; Labour more popular than Conservatives on a wide range of other issue, notably Health and Education • However, Major more popular than Kinnock • Many blame UK recession either on world recession or on Thatcher: John Major rarely considered at fault for recession • Major abolishes poll tax. Is seen as more “caring” than Thatcher • Even though economy in recession voters still trust Conservatives more than Labour as best party to manage the economy. • Interest rate cuts in run up to General Election and tax cutting budget increase likelihood of egocentric pocket book voting in support of the Conservatives.
General Election 1992[3] • Labour’s Shadow Budget proposes increases in National Insurance Contributions and higher rates of income tax for the rich although Labour’s other tax changes would help the poor disproportionately. • Conservatives raise the fear of increased taxation and increased inflation under Labour…the so-called Double Whammy. • The meaning of this term was not initially well understood but the redoutable Ken Clarke [as I remember] told us that it was an American term of the kind which might be used by Sergeant Bilko. • Very negative anti- Labour campaigns in the Tory Tabloids in the months prior to the election campaign and especially during the final days of the campaign itself. • Short term impact of mass media on voting behaviour should not be overstated but this short term campaign reinforced the criticisms of Labour which the Tory tabloids had been making for generations: net impact possibly large but no-one knows how large
General Election of 1997 : The Result [1]{Electoral system benefits Labour]
General Election 1997 [2]: The Conservatives • Exit from ERM Sept 1992 [Black/White Wednesday] undermines Conservative long standing reputation for economic competence. Gradual economic recovery 1992-1997 fails to translate into opinion poll recovery. Labour ahead in polls Sept 1992-May 1997 and subsequently. • John Major perceived as a weak leader leading a party disunited especially over Europe. Maatstricht treaty rebellions and 1995 Conservative leadership election symbolise Major’s weakness. • Conservative Party further undermined by allegations of Sleaze: Cash for Questions; Ministerial sex scandals; hypocrisy of Major’s “Back to Basics” campaign. Sleaze prominent in the 1st week of the actual campaign…harms the Conservatives • Elements of Conservative press critical of Conservative Government as insufficiently Eurosceptic. Sun backs Blair.
General Election 1997[3]: Labour • Likelihood that Labour would have won 1997 General Election under leadership of John Smith but with smaller majority? • More radical changes to the Labour party were considered necessary by so-called “modernisers” Blair, Brown, Mandelson. • The electoral strategy: to retain the support of traditional Labour supporters while reaching out to the aspiring working class and middle class voters of “Middle Britain”. • Emphasis on courting the pro-Conservative press [especially the Sun but also the Daily Mail] to reduce the likelihood of the kind of press coverage which damaged Labour in 1992 • Emphasis on creating an image of economic competence and moderation :redrafting of Clause 4 of the Labour Party Constitution; announcement[1995] that the Trade unions could expect “fairness not favours” from a future Labour government; no changes to Conservative spending plans for two years; no increase in income tax rates for lifetime of Parliament.
General Election 1997[4]: Labour • Tony Blair: ex Public School; ex Oxford; Lawyer; perceived as moderate, modern and dynamic; seen as a better potential PM than Major. Click for relevant Excel diagram • Labour considered to have the better policies on the most salient issues of the campaign. A preference for Labour would have been expected on issues such as Health and education but Labour had also nullified the traditional Conservative advantage on law and order [by moving to the Right… Blair and “Tough on crime; tough on the causes of crime] and on the economy. • The Electorate was as yet not specially conscious of any rifts between Blair and Brown and the Labour Party was perceived as more united than the Conservatives. • Labour’s overall image was better than that of the Conservatives on a wide range of criteria.