AESuniversity Ad hoc Reporting Version 5
280 likes | 445 Vues
AESuniversity Ad hoc Reporting Version 5. ad hoc. for the special purpose or end presently under consideration concerned or dealing with a specific subject, purpose, or end - dictionary.com. Why use ad hoc reports?.

AESuniversity Ad hoc Reporting Version 5
E N D
Presentation Transcript
ad hoc for the special purpose or end presently under consideration concerned or dealing with a specific subject, purpose, or end - dictionary.com
Why use ad hoc reports? There may not be a management or application report that gives the information you need May need very specific information You can check large amounts of data Send the report to Excel to do further calculations or turn into graphs
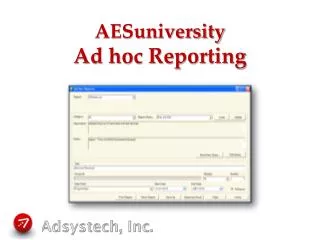
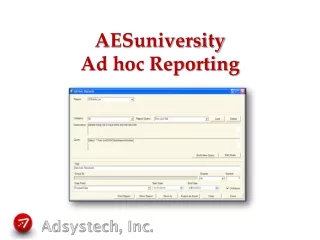
Adhoc Reporting • Make sure correct Role is selected • (HMIS, CSBG, Head Start, etc.) • Click Reports Role button • Navigation pane displays Reporting pages • Inventory page • Select saved query • View Builder page • Select View and Fields • Query Builder page • Set Parameters, Grouping, Conditions,
Working with a saved Query • Adhoc Reports Inventory page • To filter list, select Category • Enter Query Name or leave blank • Click SEARCH • Matching Reports display in grid • Parameters of selected Report display in fields at top
Working with a saved Query 3 1 2 Make sure to have correct Role active Open Adhoc Reports Inventory page Select Category Enter Report Name Click SEARCH Results will be displayed in grid and parameters of selected report will be displayed in fields at the top
Saved Query - Edits • You can change: • Title • Description • Drilldown • Date parameter and date range • Group Sort • Report List/Type • You cannot change: • Grouping • Items included in report • Filters
Saved Query – View • To see report • Click DISPLAY • Or check Popup window and click DISPLAY to view in Popup window
Edit Saved Query • Add or delete items: • View Builder page shows • Available Fields • Selected Fields • Save Query • To save as an additional Query • Change Name at top of page • Click SAVE
Create New Query • View Builder page • Select View (From tab) • Select Fields for Query (Select tab) • Query Builder page • Set Conditions (Where tab) • Select Grouping (Report Grouping tab) • Enter Parameters • Save • Show Report
Create new query – View Builder • Click NEW at top • Enter Query Name • Select View • Select Field(s) • Click Right Arrow • Use Up & Down Arrows to adjust order • Make sure to include all fields to Group by • Click Distinct if needed • Click SAVE
Creating New Query – View Builder 6 2 1 3 5 4 • Make sure to have correct Role active • Open Adhoc Reports View Builder page • Click NEW • Enter Report Name • Select View • Select Field(s) • Click Distinct if needed • Click Right Arrow • Click SAVE
Create new query – Query Builder • Set Conditions (not required) • Select Grouping (required) • Enter Parameters (required) • Save or Save As • Show Report
New query – Conditions • Click ^ to open conditions • + to add a condition • Select field • Select Operator (Is Equal to, Is Like, Is Greater Than, etc.) • Enter Value • Tools change or move condition • (+) adds or deletes parentheses • Check checks query for accuracy • Applies Query to data
New query – Grouping • Grouping is the categories or sections of the report • Each Grouping level will give you a count • To create Grouping: • Click on a Column Header • Drag to space above grid • Click additional column headers for multiple groupings • Hover over Grouping to see X to close
New query – Parameters • Required: • Title • GroupSort • Select All, Top or Bottom • Number needed only if Top or Bottom • ReportList • Select from available Report Types
New query – Parameters • Other Parameters • Date: select date field to use • Select Date Range – Start & End Dates • Description: helps to identify saved query • Category: will save in selected category • DrillDown: includes data, not just count
New query – Show Report • Click SHOW REPORT • Report opens in new tab • Return to Query Builder to Save • Click SAVE to save query • Or enter new Report Name and click SAVE AS
Preview Report 3 2 6 4 5 1 2 5 Opens Page thumbnails Page Navigation Print Export Zoom buttons Search
Types of ad hoc reports 50 Fields List – most information of all types Fields List – good to view data that do not work with sums or counts Group and List/Group and List Sum – can get counts and sums, only shows 5 – 6 items Pie Charts – good to show relationships within one data set Cylinder Chart – compares items in data set Matrix Charts – can show more complex relationships
50 Fields List Displays the most information of all report types Useful for checking data Best to export to excel
Fields List Useful for items that do not need sums or counts Use for items too big to fit into columns – like Comments
Group List Sum / Group & List Creates Count, Sum and Average for each Group and for the total Calculations are for the item selected first Can only fit 5 – 6 items across on the page Group & List does not include the calculations, just the data
Pie Charts Shows size of items on one data series, proportional to the sum of the items Useful if there is only one data series to view Limit it to ten or less categories
Cylinder Charts Useful for illustrating comparisons among items Can help clarify relationships and highlight patterns Item selected first in Grouping determines the X-Axis field
Matrix charts • Matrix charts show data arranged in a grid or matrix format • Four types of Matrix charts: • Listing lists just the data • Count provides counts of occurrences of the data • Distinct Count counts distinct occurrences • Sum provides a sum of the data
Matrix List Charts First item selected on SELECT tab is the data that will be displayed in the grid Up to 4 other items can be selected and will be shown in the row Matrix Count would show the number of services Grouping here = -Program, Service-Program, Caption
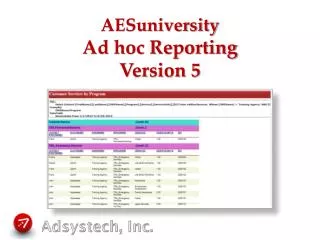
Matrix Count Charts Service Unit was selected first, so it shows in the Grid Grouping is Program, Program Component, Service